
 Andrew Graft
Ray Bradbury – author of the space travel and colonization classic The Martian Chronicles – once wrote, “Half of the fun of travel is the aesthetic of lostness.”
What did Mr. Bradbury mean when he penned this now famous quote? We may never know.
Don’t get the wrong idea, of course. We get the part about travel being extra rewarding when people get far off the beaten path into places they didn't even know existed. (Duh.)
What civilization will always wonder is this. Did he mean “half” in the general sense, as in give or take a third? Or “half” in the 50% sense, where if he’d meant 51 percent, he’d have said 51 percent?
Whatever the math behind Ray’s statistical calculations, one thing we know for sure…
People looooooove to travel.
Families and individuals of all ages, sizes and incomes. To faraway lands. For weekend getaways. To pursue new business deals. With kids. Without kids. On planes, trains, automobiles, boats and buses.
 And when it comes to the best corporate discount programs, association member benefits, white-label rewards programs, and membership perks in general, discounted travel is often among the most hotly pursued additions to the mix. Why?
Because our hard-earned PTO is usually spent on travel. Because lots of money AND emotional expectation are wrapped up in most of our travel purchase decisions.
So to better understand today’s traveler, we at Access have compiled what we believe is a comprehensive “ultimate collection” of statistics having to do with the travel and tourism industry. We've tried to make this list as relevant as possible, which means we combed through recent research from travel and tourism related sources.
Most of these stats are focused on Americans who travel – though other nationalities may creep into the mix from time to time. We've provided source links for each statistic. Sometimes you’ll find the data conflicts with other sources - so we’ll leave it up to you to decipher which is most accurate.
We'll keep this list updated regularly with the latest and greatest. If you know of a stat we're missing, or want your own research included in our collection, leave us a note in the comments. Enjoy!
- The Cost of Travel: How Much People Spend
- Demographics: A Profile of People Who Travel
- Destinations: Where People Go When They Travel
- Reasons & Decisions: Why People Travel & How They Decide
- Activities: What People Do When They Travel
- Other Travel Statistics

Travel Costs: How Much People Spend
- When comparing travel prices of April 2019 (last pre-pandemic month) to April 2023: (Nerd Wallet, 2023)
- Airfare prices are up 9.6%
- Hotel prices are up 15.3%
- Car rental prices are up 51.4%
- Restaurant prices are up 24.2%
- Entertainment prices are up 18.2%
- Despite inflationary pressures, only 5% of travelers said they will or have already decreased their travel budget (Insider Intelligence, 2023)
- 34% of consumers say their personal financial situation has a negative impact on their willingness to travel (Morning Consult, 2023)
- 69% of travelers would spend more during a vacation if they knew it supported the local community (American Express, 2023)
- Nearly 25% of global travelers plan to travel more frugally in 2023 (Expedia, 2023)
- 38% of travelers cook their own food to cut down on vacation costs (Expedia, 2023)
- 84% of travelers plan to spend more on travel this year than in 2022 (Hopper, 2023)
- Travelers who fly midweek can save an average of $90 off domestic airfare and $140 on international airfare (Hopper, 2023)
- 56% of travelers plan to increase per person travel spending over 2019 (the last pre-pandemic year) (The IRF, 2023)
- 85% of travelers from North America and 73% from the rest of the world are most concerned about inflation and rising costs (The IRF, 2023)
- U.S. businesses expect their international share of travel costs will jump 33% in 2023 (Deloitte, 2023)
- 1/3 of US businesses say they need to reduce travel per employee by more than 20% to meet their 2030 sustainability targets (Deloitte, 2023)
- 71% of US businesses expect a full recovery in travel spend by the end of 2024 (Deloitte, 2023)
- US businesses expect to that 33% of their business travel budget will be on international trips (16% on trips to Europe, 10% to South America and 10% to Asia) (Deloitte, 2023)
- Higher travel prices is the number one factor slowing the return of business travel, followed by travel restrictions and reduced travel budgets (Deloitte, 2023)
- 90% of businesses will reimburse for non-hotel accommodations, up from 50% in 2022 (Deloitte, 2023)
- To help control business travel spending, 59% of businesses are picking cheaper, alternative lodging, 58% are negotiating preferred rates, 56% are picking lower-cost flights and 45% are limiting travel frequency (Deloitte, 2023)
- 49% of travelers will spend more on travel in 2023 because of missed vacations during the pandemic. 43% will maximize their experience and 33% will shop for items not available back home (Booking.com, 2023)
- The highest priority for most travelers financially is restaurants/dining experience (34%) followed by suitable accommodations (32%), all-inclusive accommodations (28%), travel insurance (27%) and purchasing souvenirs (25%) (Booking.com, 2023)
- Travelers save money when booking vacations by: (Booking.com, 2023)
- Using deals, hacks and smartly-timed travel (63%)
- Planning further in advance (61%)
- Using discounts and loyalty programs (60%)
- Taking 2 longer vacations rather than more short ones (55%)
- Choosing off-season destinations or longer routes (53%)
- 69% of millennials use technology to help save money when traveling (Booking.com, 2023)
- When booking a hotel, 23% of travelers most value finding atypically low pricing, 21% value the ability to get a full refund on cancellations and 14% value enhanced and frequent cleaning methods most (Expedia, 2023)
- 60% of travelers say “getting the right price” is the most important feature of online travel booking sites (Expedia, 2023)
- When booking travel, consumers value the following deals the most: (Expedia, 2023)
- A complimentary add-on (like free parking) (33%)
- A discount for booking in advance (33%)
- A discount for booking a package (32%)
- A discount for booking last minute (22%)
- A discount for booking a longer stay or trip (22%)
- A discount for booking through a mobile app (21%)
- A discount for a specific location (20%)
- A discount for being a member of the travel provider’s loyalty program (17%)
- 37% of travelers prioritize lowest cost when booking travel, 35% prioritize minimizing COVID-19 exposure (Expedia, 2023)
- 51% of consumers say inflation will impact their travel plans over the next 12 months (Expedia, 2023)
- 31% of travelers say their travel budget will be the same this year as it was last year, 43% have a larger budget this year (Expedia, 2023)
- 1 in 3 consumers are planning an upcoming business trip (Expedia, 2023)
- Americans are more willing to splurge on travel plans in 2022: 15% will upgrade rooms or flights, 16% will visit bucket-list destinations, 32% will splurge on the things that take a trip from good to great (Expedia)
- Travelers age 18-34 are the most likely to go big on their next trip (80% compared to 56% of travelers over 50) (Expedia)
- Gen X travelers are the most likely to splurge on a high-end restaurant (18%, compared to 16% overall) (Expedia)
- In 2021, premium economy ticket prices were around 290% more expensive than economy tickets, compared to pre-pandemic when they were 430% more expensive (Expedia)
- 68% of Americans are planning to go big on their next trip (Expedia)
- 40% of US travelers are more willing than ever to splurge on their future travels (Expedia)
- Global travel and tourism levels are projected to reach pre-pandemic levels in 2022, contributing nearly $2 trillion to the US economy (WTTC)
- U.S. domestic travel & tourism spending is forecast to reach more than $1.1 trillion for the year, surpassing pre-pandemic levels by 11.3% (WTTC)
- International traveler spending in the U.S. could reach $155 billion which is a growth of $113 billion, compared to 2020, though it would still be slightly below (14%) 2019 levels (WTTC)
- Employment travel and tourism could surpass pre-pandemic levels, reaching nearly 16.8 million jobs, which is above pre-pandemic levels by almost 200,000 jobs (WTTC)
- Airline losses from 2020-2022 could reach $200 billion (IATA)
- After reducing costs in 2021 by 34%, expenses are expected to rise again in 2022 due to expanded operations and higher fuel prices, averaging only 15% lower than pre-pandemic levels (IATA)
- Boomers plan to spend the most of any generation: at least $4,000 on travel in the next 12 months (MMGY)
- With the rising price of fuel, domestic flight prices rose 36% in March 2022 from the beginning of the year to reach an average price of $300 (Bloomberg)
- The 2022 travel price index rose 12%, mostly driven by a 44% increase in motor oil (US Travel)
- The January 2022 travel price index was 11.6% higher than 2019 levels (on par with consumer prices overall) (US Travel)
- In January 2022, travel spending declined to $79 billion, this is down from $92 billion in December and down 11% from January 2019 levels (US Travel)
- 50% of travelers would not pay extra for plane fare that offers free cancellation, 17% would pay up to $20 more, 16% would pay $20-$49 more and 9% would pay $50-$99 more (Morning Consult)
- 56% of travelers would not pay extra for plane fare from a company that prioritizes pandemic safety, 17% would pay up to $20 more, 13% would pay $20-$49 more and 9% would pay $50-$99 more (Morning Consult)
- 51% of Americans who traveled in the spring of 2021 plan to spend more when they travel in 2022, 23% plan to spend significantly more (Trip Advisor)
- Average spend per booking for US travelers in spring 2022 is up 87% year-over-year (Trip Advisor)
- American travelers are spending 29% more on their average booking in 2022 than they did in 2019, this is despite staying an average of 3.7 days, down from 4.4 days in 2019 (Trip Advisor)
- The economic contribution of global tourism in 2021 is estimated at $1.9 trillion, above the $1.6 trillion in 2020, but still below the $3.5 trillion in 2019 (UNWTO)
- Global tourism spending is estimated to be $1,500 per trip in 2021, up from $1,300 in 2020 (UNWTO)
- In 2020, international travelers spent $83 billion compared to $233 billion in 2019, a loss of 64% (US Travel)
- In 2020, International travelers spent money on US goods and services (US Travel):
- Travel spending - $38.1 billion (compared to $139 billion in 2019)
- Passenger fares - $26.5 billion (compared to $40.1 billion in 2019)
- Education-related - $37.4 billion (compared to $44 billion in 2019)
- Health-related - $0.2 billion (compared to $1.2 billion in 2019)
- Border/seasonal workers - $7.6 billion (compared to $9.1 billion in 2019)
- US travel spending in 2020 totaled $680.3 billion ($642.2 billion domestic travel spending and $38.1 billion international spending) (US Travel)
- US travel spending in 2019 totaled $1,172.6 billion ($993.5 billion domestic travel spending and $179.1 billion international spending) (US Travel)
- In 2019 traveler spending totaled $1.1 trillion: $278.9B for food services, $242.3B for lodging, $210.8B for public transportation, $169.7B for auto transportation, $117.8B for recreation/amusement and $107.3B for retail (US Travel Association)
-
Direct spending on leisure travel by domestic and international travelers totaled $792.4 billion in 2019 (US Travel Association)
-
Direct spending on business travel by domestic and international travelers totaled $334.2 billion in 2019 (US Travel Association)
-
Travel and tourism was the second most-popular choice for discretionary spending (Phocuswright)
-
In 2019, domestic travel spending grew 4.4% (for leisure grew 5.1%, for business grew 2.8%) (US Travel Association)
-
Millennials spent $4,400 (avg.) on travel in 2019, (Gen-Xers’ $5,400; Boomers’ $6,600) (CNBC)
-
Domestic travel expenditures industry breakdown for 2019 were: food services 25%, public transportation 20%, lodging 20%, auto transportation 17%, recreation/amusement 11%, retail 7% (US Travel Association)
-
On average, Americans plan to spend $737 on their upcoming trip. Gen Xers will spend more than other age groups, and parents of kids under 18 plan to shell out more than $1,000 (Value Penguin)
-
The average expense for a 4-night domestic vacation is $581 (or $144 per day): $224 for transportation, $150 for lodging, $155 for food/alcohol and $52 for entertainment (Value Penguin)
-
The average expense for a 12-night international trip is $3,251 (or $271 per day): $1,755 for transportation, $683 for lodging, $520 for food/alcohol and $293 or entertainment (Value Penguin)
-
Americans spend an average of $33 per day on food when on a domestic vacation, about 80% of which is spent in restaurants (Value Penguin)
-
Americans spend an average of $35 per day on food when on an international vacation, about 90% of which is spent in restaurants (Value Penguin)
-
36% of travelers rated travel as an important spending priority (Phocuswright)
-
$1,036 billion was spent on traveling in 2017 (US Travel Association)
-
2.7% of the nation’s gross domestic product (GDP) attributed to travel and tourism (US Travel Association)
-
Business travel accounted for $317.2 billion in spending in 2017 (US Travel Association)
-
Leisure travel accounted for $718.4 billion in spending in 2017 (US Travel Association)
-
Americans spend $101.1 Billion on summer vacations (Travel Agent Central)
-
On average, Americans will spend $1,978 on summer vacations (Allianz Travel Insurance)
-
The average international trip for American travelers now costs $6,080 (Squaremouth)
-
Vacationing millennials (ages 18-34) spent, on average, $1,373 on summer vacations (Allianz Travel Insurance)
-
56% of travelers aged 25-34, spend $500-$1500 for a one week trip, excluding airfare (Solo Traveler)
-
Baby Boomers (ages 55+) spent an average of $1,865 on summer vacations (Allianz Travel Insurance)
-
Baby Boomers plan on spending over $6,600 on their 2019 travel (AARP)
-
Generation X (ages 35-54) spent an average of $2,628 on summer vacations (Allianz Travel Insurance)
-
The typical traveler anticipates spending nearly $3,900 on vacations in 2018 (Destination Analysts)
-
On average, Americans in the South spent less on vacationing ($564 on domestic and $3,169 on international) compared to the Northeast, Midwest, and West (Reward Expert)
-
Baby Boomers expect to take 4-5 leisure trips next year, spending up to $6,395 on travel expenses - the same or more than they spend in 2017 (AARP)
-
Generation X will spend up to $5,434 on travel and millennials up to $6,802 in 2018 (AARP)
-
26% of American domestic travel expenses go towards food services, 20% towards public transportation, 20% towards lodging, 17% towards auto transportation, 10% towards recreation/amusement and 7% towards retail (US Travel Association)
-
Travelers who book their activities ahead of their trip spend 47% more on lodging than those who wait to book (Booking.com)
-
Lodging costs are about 26% of total travel expenditures for domestic trips, and 21% for international trips (Value Penguin)
-
On average, excluding airfare, 30% travelers aged 55-64 spend $1500-$2500 on a one-week trip (Solo Traveler)
-
The average cost for American travelers to visit Norway is $9,754 (Squaremouth)
-
The average daily rate for hotels in the United States was $126.72 in 2017 (Statista)
-
Activities are the third largest segment of travel at $129 Billion (Phocuswright)
-
$220.4 million was spent on lodging in 2017 (US Travel Association)
-
$106.6 million was spent on recreation/amusement in 2017 (US Travel Association)
-
Food plus alcohol take up about 16% of the budget for an American’s international trips, and about 27% of their domestic trips (Value Penguin)
-
Transportation costs make up 54.3% of international trip expenditures and 39.1% on domestic trips (Reward Expert)
-
More than 25% of travel costs go toward food for domestic travel and 16.2% for international travel (Reward Expert)
-
37% of travelers are very likely to splurge on food and drink experiences (WYSE Travel Confederation)
-
4% of travelers are likely to splurge on first or business class air fare (WYSE Travel Confederation)
-
27% of travelers are likely to spend more on events or festivals (WYSE Travel Confederation)
-
12% of travelers are likely to splurge on guided tours (WYSE Travel Confederation)
-
The typical vacationing U.S. family spends about 44% of their travel funds getting to, from, and around their destinations (Value Penguin)
-
Travelers who book their activities ahead of their trip spend 81% more on transportation than those who wait to book their destination (Booking.com)
-
The average traveler spends about 9% of their vacation budget on entertainment (Value Penguin)
-
65.3% of Americans say that leisure travel is somewhat of a budget priority for them (Destiantion Analysts)
-
47% of millennials say cost is a barrier for why they won’t travel (AARP)
-
Millennials are the most likely to go into debt for travel (Travel Pulse)
-
83% of families will splurge on their travel destination when planning a vacation, 68% on paid attractions, 68% on staying close to their destination, 63% on eating out/food and 63% on the length of their trip (NYU)
-
62% of families will skimp on souvenirs/shopping when planning a vacation (NYU)
-
24% of solo travelers spend more than $1,500 for one week of vacation (excluding airfare) (Solo Traveler World)
-
Each overseas traveler spends approximately $4,200 when they visit the U.S. and stays on average 18 nights (US Travel Association)
-
Experience beats expense when it comes to family travel (Expedia Group)
-
Flying coach instead of business saved business travelers $2,975 on average per round-trip flight (Rocketrip)
-
Dropping a hotel star class saved business travelers $54 on average per night (Rocketrip)
-
42% of Americans paid lodging costs for domestic travel vs. 60% for international travel, as domestic travelers often stay with family and friends (Value Penguin)
-
Staying with friends or family saved business travelers $234 on average per night (Rocketrip)
-
Staying at an Airbnb saved business travelers $110 on average per night (Rocketrip)
-
Taking an early-bird flight saved business travelers $66 on average per round-trip flight (Rocketrip)
-
Taking a low-cost carrier saved business travelers $281 on average per round-trip flight (Rocketrip)
-
Managers saved an average of 15% per trip, $572 per year and took an average of 5 trips per year (Rocketrip)
-
Directors saved an average of 12% per trip, $684 per year and took an average of 6 trips per year (Rocketrip)
-
Vice Presidents saved an average of 11% per trip, $651 per year and took an average of 6 trips per year (Rocketrip)
-
CXOs saved an average of 9% per trip, $1,081 per year, and took an average of 8 trips per year (Rocketrip)
-
Vacation spending is equal to about 2% of the total budgets of all U.S. households annually (Value Penguin)

Traveler Demographics: A Profile of People Who Travel
- When comparing travel prices of April 2019 (last pre-pandemic month) to April 2023: (Nerd Wallet, 2023)
- Airfare prices are up 9.6%
- Hotel prices are up 15.3%
- Car rental prices are up 51.4%
- Restaurant prices are up 24.2%
- Entertainment prices are up 18.2%
- Of travelers who subscribe to travel related paid subscriptions, 62% are male and 38% are female (Trip Advisor)
- Of American travelers who subscribe to a travel related paid subscription program, 11% are between the ages of 18-24, 26% are 25-34, 22% are 35-44 and 25% are 55+ (Trip Advisor)
- Millennials are planning to take the most trips of any generation: an average of 4.4 trips in the next 12 months (MMGY)
- 52% of active leisure travelers are members of at least one hotel loyalty program, and 48% have joined at least one airline loyalty program (MMGY)
- Millennials are 11-percentage-points more likely to stay at a chain hotel than the general population (Morning Consult)
- Travelers with an income of less than $50,000 are the least likely to say price is a top priority (Morning Consult)
- 42% of US Adults who took more than 3 business trips per year pre-pandemic expect to never travel for business again, 14% expect to take a business trip after more than a year, 10% within 7-12 months, 13% within 4-6 months, 13% within 1-3 months and 7% in less than a month (Morning Consult)
- More employed travelers anticipate taking a blended trip (combining business and leisure travel) in the next year: 40% with an even split between business and leisure, 40% blended primarily business and 44% blended primarily leisure. 41% of travelers anticipate taking a business only trip this year and 76% taking a leisure only trip (Morning Consult)
- Millennials are the most likely to stay at a hotel in the next 3 months at 39%, followed by boomers (28%), Gen X (23%) and Gen Z (9%) (Morning Consult)
- 75% of travelers who plan to stay in a hotel in the spring of 2022 are vaccinated and 16% are unvaccinated (Morning Consult)
- 6% of all US adults will stay in a vacation rental in the next 3 months (Morning Consult)
- 20% of travelers with travel plans in the next 3 months expect to stay in a vacation rental (Morning Consult)
- Millennials are the most likely to stay in a vacation rental at 46%, followed by Gen X (17%), boomers (16%) and Gen Z (21%) (Morning Consult)
- US adults who have imminent travel plans are more likely to want precautions from travel brands (Morning Consult)
- Travelers predict they will next travel for leisure in 1 month (11%), 1-3 months (22%), 4-6 months (22%), 7-12 months (13%), in more than a year (19%) and never (12%) (Morning Consult)
- Travelers of all demographics are more comfortable traveling now than they were during the height of the Omicron outbreak, with high income earners and previous travelers reporting feeling the most comfortable (Morning Consult)
- In March 2022, more than half of US adults said they would travel for leisure in the next 6 months, up 6 percentage points from January 2022 (Morning Consult)
- Travelers who traveled 3 or more times a year before the pandemic (who are likely to be millennials and high income earners) are the most likely to be planning a trip soon (Morning Consult)
- While travelers in the US and many European countries are more confident about taking a leisure trip in the next 6 months, many East Asian travelers are less confident. For example, from October 2021 to March 2022: (Morning Consult)
- US travelers saw a 5-percentage-point increase in confidence (from 50% to 55%)
- German travelers saw a 17-percentage-point increase in confidence (from 46% to 63%)
- UK travelers saw a 13-percentage-point increase in confidence (from 44% to 57%)
- China travelers saw a 10-percentage-point decrease in confidence (from 47% to 37%)
- Japan travelers saw a 6-percentage-point decrease in confidence (from 33%) to 27%)
- 14% of all US adults will travel by plane in the next 3 months (Morning Consult)
- 41% of people with travel plans in the next three months expect to fly (Morning Consult)
- Millennials are the most likely to take a flight at 35%, followed by boomers (27%), Gen X (21%) and Gen Z (16%) (Morning Consult)
- 83% of travelers who plan to fly in spring of 2022 are vaccinated and 11% are unvaccinated (Morning Consult)
- 77% of US adults have stayed in a hotel or resort, 65% have flown and 27% have taken a cruise (Morning Consult)
- 51% of business travelers said they traveled for business at least four times a year pre-pandemic compared to 31% during the pandemic (Morning Consult)
- Millennials are 13% more likely to travel to a destination with cultural or historical significance (Responsible Travel)
- 20% of all travelers are Millennials, and they take an average 7.4 trips per year. (Project Time Off)
- The average millennial has planned on roughly 5 trips for 2020. (CNBC)
- Millennials spent $4,400 (avg.) on travel in 2019, (Gen-Xers’ $5,400; Boomers’ $6,600) (CNBC)
- 40% of Millennial travelers will take a vacation with their friends in the next year (Resonance Consultancy)
- American women rank first in solo traveling and are more likely to take three trips or more in a given year (Resonance Consultancy)
- 62% of Millennial parents are traveling with kids under the age of 5 (Resonance Consultancy – D.K. Shifflet & Associates)
- Roughly 35% of Millennial travelers prefer upscale and luxury hotels/resorts (Resonance Consultancy)
- 25% of families went on a family vacation that was 1-3 nights in duration (NYU)
- Travelers in the South are more likely to be making plans for a family trip this year (62%) than travelers in the Northeast (35%) (Travel Agent Central)
- 68% of family travelers will embark on a summer getaway, while 45% are making plans to travel as a family this spring (Travel Agent Central)
- 80% of families take a vacation during summer (NYU)
- 42% of families take a spring break vacation (NYU)
- 24% of families have traveled internationally with their children for multiple days (NYU)
- 43% of solo travelers travel three or more times in a year (Solo Traveler World)
- 46% of women traveling solo said they travel alone for freedom, independence, and the chance to do what they want, when they want (Solo Traveler World)
- 72% of American women are taking solo vacations (Booking.com)
- Baby Boomers expect to take 4-5 leisure trips in 2023 (AARP)
- 50% of solo travelers have a university or college degree or diploma (Solo Traveler)
- 96% of people ages 25-34 are likely to travel independently (Solo Traveler World)
- 19% of people ages 25-34 have been or are likely to go on a cruise, 9% of ages 35-44 and 41% of ages 65+ (Solo Traveler World)
- 54% of people ages 35-44 take vacation for adventure (Solo Traveler World)
- 79% of Americans would consider taking a long distance international trip during winter (Qantas)
- 58% of Millennials would travel solo and 26% already have (The Cashlorette)
- 26% of Millennial women have traveled solo before and 27% have not but would consider doing so in the future (The Cashlorette)
- 49% of millennial's take last minute vacations (Internet Marketing Inc.)
- 58% of millennials prefer to travel with friends (Internet Marketing Inc.)
- 50% of families who had paid vacation time did not use all of their vacation days in 2016 (NYU)
- 21% of families have taken their children to an all-inclusive resort for vacation, 68% on a family road trip, and 68% on a beach vacation (NYU)
- Women book tours and activities 67% of the time (TrekkSoft)
- Women are over 10% more likely to take out loans for the sake of taking a vacation (Bustle)
- Of people who traveled in 2016, 24% were solo travelers, 47% were adults, and 29% were adults with children (US Travel Association)
- 28% of low income travelers used a train on their last trip (Trip Advisor)
- 30% of people ages 55+ take a cruise for their vacation (Trip Advisor)
- Travelers with high incomes are more likely to have taken many different types of trips: adventure travel (33%), music event (31%), other festival (30%), cruise (27%), and skiing/snowboarding (20%) (Trip Advisor)
- Low income travelers are more likely to have traveled independently (38%) compared to middle (31%) and high income (31%) travelers (Trip Advisor)
- 35% of solo travelers have post-graduate degrees (Solo Traveler)

Travel Destinations: Where People Go When They Travel
- Based on searches for lodgings, the following locations are fastest growing in interest for 2023: Edinburg Scotland, Lisbon Portugal, Tokyo Japan, Dublin Ireland, New York USA (Expedia, 2023)
- 16% of travelers traveled internationally in April 2023, the highest in years (Morning Consult, 2023)
- 1/3 of travelers with leisure trips planned this year will travel internationally, 13 points higher than the same time last year (Morning Consult, 2023)
- 78% of travelers with leisure trips planned this year will travel domestically (Morning Consult, 2023)
- 48% of leisure travelers research potential destinations, 54% select a destination, 56% arrange transportation to get there and 54% arrange accommodations 3 months or less in advance (Morning Consult, 2023)
- 57% of business travelers research potential destinations, 54% select a destination, 64% arrange transportation to get there and 61% arrange accommodations 3 months or less in advance (Morning Consult, 2023)
- 68% of people pride themselves on finding lesser-known vacation spots before they become popular (American Express, 2023)
- When choosing a destination 52% of travelers trust the recommendations of friends and family most, 44% look to travel providers for inspiration and 33% look to social media (Expedia, 2023)
- 51% of consumers plan to travel by air in the next 12 months (Expedia, 2023)
- The average trip to the U.S. is 4.5 days, half a day shorter than the previous year (Hopper, 2023)
- The average trip to Europe is 16.1 days, which is 1.3 days more than the previous year (Hopper, 2023)
- The average trip to Africa and the Mideast is 24.5 days, which is 0.7 days more than the previous year (Hopper, 2023)
- The average trip to Asia is 31.4 days, which is 7 days more than the previous year (Hopper, 2023)
- The average trip to Oceania is 21 days, which is 1.6 days more than the previous year (Hopper, 2023)
- The average trip to South America is 16.4 days, which is 0.4 days more than the previous year (Hopper, 2023)
- 1 in 2 consumers are likely to travel internationally in the next 12 months or already have a trip booked (Expedia, 2023)
- The top 3 destinations for outdoor enthusiasts because of national parks and natural wonders are: 1. Arenal Volcano National Park, Costa Rica 2. Jim Corbett National Park, India and 3. Serengeti National Park, Tanzania. The top US destination for outdoor enthusiasts is Denali National Park and Preserve, Alaska (TripAdvisor)
- The top 3 destinations for food lovers because of restaurants and restaurants and foodie experiences are: 1. Rome, Italy 2. London, UK and 3. Paris, France. The top US destination for food lovers is New York City, New York (TripAdvisor)
- The top 3 destinations for big city lovers are: 1. Dubai, United Arab Emirates 2. London, UK and 3. Rome, Italy. The top US destination for big city lovers is Las Vegas, Nevada (TripAdvisor)
- The top 3 destinations for sun seekers because of pristine beaches and clear waters are: 1. Cancun, Mexico 2. Bali, Indonesia and 3. Crete, Greece. The top US destination for sun seekers is Oahu, Hawaii (TripAdvisor)
- The top 3 destinations for skiers are: 1. Zermatt, Switzerland 2. Jackson, Wyoming and 3. Banff, Alberta (TripAdvisor)
- Secluded mountain / rural escapes and waterfront getaways are the most popular vacation rentals of 2022 (Evolve)
- Only 15% of travelers booking vacation rentals are headed to urban areas in 2022 (Evolve)
- 27% of travelers favor international trips despite restrictions still in place (Evolve)
- There was a 4% rise in international tourist arrivals in 2021 from the previous year, meaning it was still down 72% from pre-pandemic levels (UNWTO)
- The pace of international tourism recovery has been uneven due to varying degrees of restrictions, vaccination rates and traveler confidence. Europe recovered 19% over 2021 and the Americas recovered 17%, while Asia and the Pacific arrivals fell 65% below 2021 levels (UNWTO)
- 71% of travelers who plan to stay in a vacation rental are vaccinated and 20% are unvaccinated (Morning Consult)
- 7 of the 10 fastest growing destinations for spring 2022 (based on YOY growth) are outside the US (Trip Advisor)
- Paris, London and Rome are the top three trending international travel destinations for spring 2022 (Trip Advisor)
- Orlando, Florida will welcome the most visitors overall in spring 2022, and Hawaii will see the greatest YOY growth from spring 2021, likely the result of relaxing its travel restrictions (Trip Advisor)
- The top 5 most popular spring travel destinations are: Orlando, Florida; Las Vegas, Nevada; Cancun, Mexico; Key West, Florida; Miami Beach, Florida (Trip Advisor)
- The top 5 fastest growing spring travel destinations are: Honolulu, Hawaii; Paris, France; Lahaina, Hawaii; London, United Kingdom; Rome, Italy (Trip Advisor)
- 65% of leisure travelers did not travel internationally in 2020 (TripAdvisor)
- 47% of travelers globally say they plan to travel internationally in 2022 (TripAdvisor)
- 30% of travelers globally say won’t travel internationally in 2022 (TripAdvisor)
- 11% of travelers have already booked an international trip for 2022 and an additional 17% say they are researching international trips with the intent to book (TripAdvisor)
- 13% of US travelers have booked an international trip in 2022 (TripAdvisor)
- Hotel searches for trips in Jan-Apr 2022 are predominantly for domestic locations, while searches for trips in May-Dec 2022 are predominantly for international locations (TripAdvisor)
- 77% of travelers globally say they will be more likely to travel internationally, and 86% domestically, if they receive the COVID-19 vaccine (TripAdvisor)
- 34% of US travelers say they are much more likely to take an international trip in 2022 once they’ve received the vaccine (TripAdvisor)
- 26% of travelers globally, 30% of US travelers, say they will only travel to destinations that require visitors to be vaccinated before travel (TripAdvisor)
- 64% of people who plan to travel in 2022, plan to take 2+ domestic trips (TripAdvisor)
- 60% of people who plan to travel in 2022, plan to take local trips (TripAdvisor)
- In the first week of January, nearly 70% of hotel clickers on Tripadvisor were booking domestic trips (TripAdvisor)
- Globally, 74% of travelers plan to take at least one domestic trip, and 45% plan at least 2 domestic trips, in 2022 (TripAdvisor)
- 34% of US travelers are planning at least three domestic trips in 2022 (TripAdvisor)
- 56% of Americans have taken a staycation recently (YouGov)
- 2020 Google searches for “staycation” have jumped 45% YoY (Google)
- AAA estimates Americans will make 700 million car trips from July-Sept 2020 (AAA)
- Popular hotels are selling out nationwide during the pandemic. (CNN)
- Post-pandemic “revenge spending” indicates travel will be among the first industries to recover. (Forbes)
- Weekly pent-up demand for post-pandemic travel continues to grow . (TravelPulse)
- Top destinations in 2019 were predicted to be The Turkish Riviera, Egypt, The Peloponnese, Matera, Perth, The Scottish Highlands, St Barths, Arles, Valle de Guadalupe and New Orleans (CN Traveller)
- The Southeast region of the U.S. (Florida, Georgia, Louisiana) captured the largest share of domestic online searches for vacation lodging at 34% followed by the Far West (Washington, Oregon, California, Nevada) at 23%, the Mideast (New York, New Jersey, Maryland, Delaware, Pennsylvania) at 14%, the Southwest (Arizona, New Mexico, Texas, Oklahoma) at 11%, Great Lakes Region (Wisconsin, Illinois, Indiana, Michigan, Ohio) at 7%, Rocky Mountain Range (Idaho, Utah, Wyoming, Montana, Colorado) at 5%, the Plains Region (North Dakota, South Dakota, Nebraska, Kansas, Minnesota, Iowa, Missouri) at 3% and the New England Region (Vermont, New Hampshire, Rhode Island, Connecticut, Massachusetts, Maine) at 3% (US Travel Association)
- Top 10 U.S. destinations for travel agencies in 2018 include: Alaskan Cruises (47.9%), Orlando (38.6%), Las Vegas (35.4%), Maui (30.9%), NYC (27.7%), Honolulu (25.7%), Hawaiian Cruise (16.5%), Miami/Miami Beach (15.5%), Washington D.C. (14.7%), Los Angeles (12.9%) (Travel Leaders Group)
- Top 10 international travel locations for travel agencies in 2018 include: Caribbean Cruise (34.7%), Cancun (28.3%), Cruise – Europe (River) (23.1%), Cruise – Europe (Mediterranean) (17.4%), Punta Cana, Dominican Republic (17.2%), Rome (16%), London (15.5%), Amsterdam and Montego Bay, Jamaica (12.6%), Playa del Carmen/Riviera Maya, Mexico (11.4%), and Pairs (11.1%) (Travel Leaders Group)
- Most popular 2019 destinations for American travelers are Florida (17%), California (11%), New York (5%), Texas (5%), and Las Vegas (5%) (AARP)
- The top five summer road trip routes are: Las Vegas to National Parks, Northern California and Southern Oregon Coast, Northern New England, Blue Ridge Parkway in North Carolina, and Black Hills in South Dakota (AAA)
- Top 2019 international destinations include Europe (41%), the Caribbean (20%), and Asia and the Middle East (11%) (AARP)
- Iceland welcomed 2.2 million foreign travelers in 2017, with 32.9% of arrivals being in the winter months (Iceland Tourist Board)
- Australia is the number one international destination for solo travel (Booking.com)
- 38% of Millennial travelers are likely to visit a major metropolitan city in the next year (Resonance Consultancy)
- 50% of Americans, 89% of Indian people, and 69% of French people have traveled to at least one country of their ancestry (Forbes 2019)
- 40% of Millennial travelers are likely to visit a beach resort in the next year (Resonance Consultancy)
- Traveling to Mexico has dropped from 22% in 2017 to 9% for 2018 (AARP)
- Travel to the United Kingdom has dropped from 15% in 2017 to 6% for 2018 (AARP)
- Travel to Canada has dropped from 17% in 2017 to 4% for 2018 (AARP)
- 7% of millennials, 3% of Gen X and 6% of Baby Boomers expect to travel only to international destinations (AARP)
- 42% of Millennials, 51% of Gen X, and 51% of Baby Boomers expect to travel only to domestic destinations (AARP)
- 51% of millennials, 46% of Gen X and 43% of Baby Boomers expect to travel to both domestic and international destinations (AARP)
- 75% of people travel within the U.S. and farther than a bordering state (Travel Leaders Group)
- 39.8% of people travel internationally (Canada, Mexico, and/or Caribbean) (Travel Leaders Group)
- Last year international tourist arrivals worldwide reached 1.4 billion (Stuff)
- 39.5% of people travel within their home state (Travel Leaders Group)
- 33.1% of people travel to a bordering state (Travel Leaders Group)
- 24% of Americans travel internationally (Europe) (Travel Leaders Group)
- 35% of Americans, are planning to take a vacation of 50 miles or more away from home involving two or more immediate family (AAA)
- 55% of families have taken their children on vacation to Florida, 31% to California, and 26% to New York (NYU)
- 41% of travelers aged 65+, go on cruises for vacation (Solo Traveler)
- 43% of families have traveled to a National Park with their children for family vacations (NYU)
- Road trips represented 22% of vacations taken by American travelers in 2016 (MMGY Global)
- 53% of traveling families expect to pack up their cars for a road trip this year (Travel Agent Central)
- 57% of global travelers take a beach vacation (Trip Advisor)
- 56% of global travelers choose a destination to explore city history (Trip Advisor)
- 52% of global travelers go on vacation to visit family/friends (Trip Advisor)
- 26% of global travelers go on vacation to attend an event or festival (Trip Advisor)
- 25% of U.S. destination selectors say they actively research new trips at least once a month (Phocuswright)

Reasons & Decisions: Why People Travel & How They Decide
- 46% of travelers will opt for the travel option with the best customer reviews over the best value (Expedia, 2023)
- 61% of travelers named price as a top priority when booking transportation, 49% said a brand’s safety measures, 41% said fare flexibility, 38% said past experience with a brand, 29% said amenities available, 22% said environmental impact (Morning Consult, 2023)
- 62% of travelers named price as a top priority when booking accommodations, 48% said a brand’s safety measures, 45% said rate flexibility, 39% said past experience with a brand, 37% said amenities available, 31% said loyalty program perks and 28% said potential to earn/redeem loyalty points (Morning Consult, 2023)
- 59% of travelers booked a leisure trip because they want to get away (Morning Consult, 2023)
- 52% of travelers booked a leisure trip because they want to visit family or friends (Morning Consult, 2023)
- 17% of leisure travelers booked a trip for a special event (Morning Consult, 2023)
- 11% of travelers booked a leisure trip because they found a deal they couldn’t pass up (Morning Consult, 2023)
- 85% of people plan to take 2+ leisure trips in 2023 (American Express, 2023)
- 78% of people see travel as an important budget priority (American Express, 2023)
- 74% of people care more about creating a travel experience that meets their expectations than about the cost (American Express, 2023)
- 89% of people want to travel to destinations they’ve never visited before (American Express, 2023)
- 79% of Gen-Z an millennials would love to participate in “a day in the life of locals” at their travel destinations (American Express, 2023)
- 75% of travelers have been inspired by social media to a specific destination, 64% were inspired by TV shows, movies or the news (American Express, 2023)
- 48% of travelers want to travel somewhere so they can show off on social media (American Express, 2023)
- 47% of travelers are influenced by recommendations from family and friends in choosing travel destinations (American Express, 2023)
- 66% of gen-z and millennials get most of their inspiration for what and where to eat while traveling from social media (American Express, 2023)
- 2/3 of travelers have considered, and 39% have booked trips to destinations after seeing them on streamed shows or movies (Expedia, 2023)
- Globally, 38% of travelers plan to book a hotel with extras like plush toiletries or free breakfast (Expedia, 2023)
- On average, travelers first search for their trip 5 weeks before departure, and book 3 weeks before departure (Hopper, 2023)
- 40% of travelers start researching with firm destination and dates in mind (Hopper, 2023)
- 37% of travelers start researching with flexible destination and dates (Hopper, 2023)
- 55% of consumers plan to travel more in 2023 than they did in 2022 (iSeatz, 2023)
- 72% of consumers who received personalized recommendations on their booking site report that their loyalty programs deliver what they value most, only 48% of those who receive personalized recommendations through email say the same (iSeatz, 2023)
- About 1/3 of travels are likely to choose a destination that is within a drivable distance (Expedia, 2023)
- 62% of people prefer to drive when traveling, making it the most popular mode of transportation (Expedia, 2023)
- 23% of travelers are seeking a once-in-a-lifetime experience (Expedia, 2023)
- 43% of travelers will use virtual reality to inspire destination choices (Booking.com, 2023)
- 73% of travelers are more optimistic about travel in 2023 than they were in 2022 (Booking.com, 2023)
- 72% of travelers say traveling is still worth it even amidst of global economic and political uncertainty (Booking.com, 2023)
- 70% of travelers say they are more likely to choose travel options that are more inclusive, even if they’re more expensive (Expedia, 2023)
- U.S. travelers return to booking apps to double check travel prices 33% more often (Hopper, 2023)
- On average, travelers allow 30% less travel planning time when researching and booking trips (Hopper, 2023)
- 29% of travelers will travel in 2023 related to trips or events that were delayed by the pandemic (Hopper, 2023)
- 77% of travelers will tack personal travel onto their work trip (Hopper, 2023)
- 57% of travelers prioritize making sure the experience is worth the cost, 51% prioritize cleanliness and safety (Expedia, 2023)
- 49% of travelers say they are motivated to travel for physical and mental health benefits, 49% for a change in scenery, 46% want to make up for lost time with friends and family (Expedia, 2023)
- 78% of people have made a travel choice based on promotions or ad they felt represented them through messaging or visuals (Expedia, 2023)
- 60% of travel businesses have made changes in the last year to increase inclusivity and accessibility, an additional 21% have plans to do so (Expedia, 2023)
- 90% of consumers are looking for sustainable options when traveling (Expedia, 2023)
- 47% of consumers would never book non-refundable lodging, and 51% would never book non-refundable transportation (Expedia, 2023)
- 76% of business travelers plan to extend a work trip for leisure purposes in the next 12 months (Expedia, 2023)
- 28% of people plan to take a trip in the next 12 months which will include both remote work and vacation leisure (Expedia, 2023)
- 37% of people will travel for business for the reason of meeting and working with customers, 32% for industry conferences and events and 26% for internal team meetings (Expedia, 2023)
- The most popular reasons for travel cited by American travelers include: rest and relaxation (51%), escaping day to day life (49%) and visiting family and friends (44%) (Trip Advisor)
- 34% of travelers would be significantly less likely to travel if scientists determine Omicron is more resistant to current vaccines, 32% if scientists determine Omicron is more easily transmitted (MMGY)
- Vaccinated travelers are on average more cautious than unvaccinated travelers (MMGY)
- Business travel sentiment improved in February 2022 to 89% (US Travel)
- Nearly 9 in 10 companies are planning business travel in the next 90 days (as of Feb 2022) (US Travel)
- 82% of American travelers are excited to travel in the next 12 months—the highest level since the start of the pandemic (US Travel)
- 82% of business travel organizations felt their employees were willing to travel in February 2022, up from 54% in January (US Travel)
- 40% of US travelers want the feeling that they have made the most out of their trip (Expedia)
- 37% of US travelers admit to being less spontaneous since the onset of COVID-19, but 25% are willing to be more spontaneous and another 26% are aiming to be more flexible this time around (Expedia)
- 24% of travelers plan to spend less time on their devices and be more present (Expedia)
- 27% of travelers aim to spend more time at their destination in order to fully experience all it has to offer (Expedia)
- Of travelers who combine business and leisure travel into a trip consider this a major motivating factor: (Morning Consult)
- Makes the trip more fun (46%)
- Less expensive fares because of flexible timing (43%)
- Visit friends and family more often (43%)
- Travel to places you couldn’t otherwise (44%)
- Save on costs because employer covers part (43%)
- Earn more loyalty/rewards points (37%)
- 45% of the blended (business and leisure) trips planned in the next 12 months will be 2-3 days in length, 34% will be 4-6 days, 14% will be 1-2 weeks and only 5% will be longer than 2 weeks (Morning Consult)
- Fast and free Wi-Fi is the most preferred amenity by travelers for “workcations” (Morning Consult)
- Travelers over 40 are nearly 4x as likely to book trips longer than 1 week, and 5x as likely to book trips longer than 2 weeks than travelers under 40 (Evolve)
- 54% of travelers under 40 prefer trips 3-4 nights in length (Evolve)
- Despite pandemic uncertainty, only 4% of travelers don’t plan to travel in 2022 (Evolve)
- 50% of travelers cite flexible cancellation/rebooking policies as a top factor in their 2022 travel decisions – much more than the 23% who prioritized cleanliness (Evolve)
- 80% of travelers are actively moving forward with 2022 travel plans (Evolve)
- Of travelers with 2022 travel plans, 47% say they won’t consider cancelling until much closer to their trip dates and 32% plan to travel no matter what happens (Evolve)
- 86% of respondents plan to book a vacation rental in 2022, and another 14% said “maybe” (Evolve)
- 62% of travelers plan on taking 3 or more trips in 2022 (Evolve)
- The average trip length will likely be 5-7 nights in 2022, compared to 3.8 nights in 2020 and 2021 (Evolve)
- 16% of all US adults will stay in a hotel in the next 3 months (Morning Consult)
- 49% of US adults who have travel plans in the next 3 months expect to stay at a chain hotel (Morning Consult)
- 53% of Americans plan to travel in the spring of 2022, 39% plan to take 2 or more trips (Trip Advisor)
- 35% of Americans reported traveling in the winter of 2021 (Trip Advisor)
- Often a travel business’ loyalty program is worth more than the brand itself. For example, AAdvantage, American Airlines’ passenger loyalty program is valued between $19.5 - $31.5 billion compared to American Airlines which is valued at $6 billion (Catalyst)
- Travel and hospitality loyalty programs (Catalyst)
- 80% of travel and hospitality marketers say their organization has a loyalty program (Catalyst)
- The average tenure of travel and hospitality loyalty programs is 6.5 years (Catalyst)
- 1/3 of travel and hospitality loyalty programs have undergone a recent refresh (Catalyst)
- 2/3 of travel and hospitality marketers feel they use loyalty best practices in running their programs (Catalyst)
- 77% of travel and hospitality loyalty programs offer transactional rewards, such as the ability to earn and redeem points (Catalyst)
- 69% of travel and hospitality loyalty programs offer member-only discounts (Catalyst)
- 61% of travel and hospitality loyalty programs offer rewards focused on access and personalization, like priority or exclusive access to the best rooms, seats or amenities (Catalyst)
- 59% of travel and hospitality loyalty programs offer personalized gift recognizing significant dates, like the member’s birthday (Catalyst)
- 1/3 of travel and hospitality brands that aren’t leading the industry in loyalty have no loyalty program at all, though 21% of those brands say they will have one in the future (Catalyst)
- 2/3 of the travel and hospitality industry’s leading loyalty programs use personalization methods, while only 48% of the industry’s non-leading loyalty programs do (Catalyst)
- 33% of Americans who won’t travel in 2022 say it’s because of possible travel restrictions, 25% because they are concerned about getting exposed to COVID-19 and 20% because enhanced safety precautions would make their trip less enjoyable (Trip Advisor)
- 70% of Americans use an establishment’s cleanliness as an important factor in travel decision making (Trip Advisor)
- 63% of American travelers would like to see safety measures at hospitality businesses continue even after COVID-19 cases have dropped worldwide (Trip Advisor)
- 52% of American travelers believe it’s more important that they spend time researching their travel plans before booking than it was before the pandemic (Trip Advisor)
- 17% of American travelers subscribe to a travel related paid subscription program, and an additional 23% would be open to joining in the future (Trip Advisor)
- US travelers would be motivated to join a travel related subscription program with hotel or flight rate deals and special offers/discounts (36%), cash back rewards on travel bookings (36%), hotel perks and special offers like free breakfast, late check outs, etc. (32%) and travel insurance or free airline status upgrades (about 25%) (Trip Advisor)
- Travelers’ biggest concerns that make them less likely to travel include: concern about others’ behavior (51%), a loved one’s health/safety (48%), concern about how COVID-19 is affecting society (47%), personal health/safety (47%), COVID-19 quarantine requirements (46%), personal financial situation (37%) and expectations to report in-person to job (29%) (Morning Consult)
- The most commonly sited reasons for leisure travel by US adults included: (Morning Consult)
- to relax (56%)
- to spend time with friends and family (56%)
- to escape/get away (55%)
- to experience adventure (27%)
- to improve mental health (27%)
- to seek out cultural experiences (19%)
- to check a location off a bucket list (15%)
- to spend time on one’s own (14%
- to attend a specific event (13%
- to experience luxury (9%)
- to improve physical health (8%)
- International traveler’s reasons for leisure travel varied by reason. For example, more German travelers were motivated by relaxation (77%) and more French travelers were motivated by wanting to escape or get away (68%) (Morning Consult)
- 74% of travelers say they will spend more time choosing a destination this year in 2022 (TripAdvisor)
- 66% of travelers say they will spend more time reading reviews about destinations in 2022 (TripAdvisor)
- 72% of travelers say they will spend more time selecting their accommodations in 2022 (TripAdvisor)
- 70% of travelers say they will spend more time finding things to do at their travel destination in 2022 (TripAdvisor)
- The top factors that influence consumer trust in travel and hospitality businesses include (Morning Consult):
- Is reliable or dependable (85%)
- Has good customer service and is responsive to problems (84%)
- Protects customers’ data, privacy and security (83%)
- They have a good safety record (83%)
- They make me feel secure and safe (83%)
- Consistently delivers on what they promise (82%)
- Is a good value for the price (82%)
- Treats customers well , even in tough times (82%)
- They regularly clean and sanitize (81%)
- Has always treated me well (80%)
- The top factors that cause consumers to lose trust in travel and hospitality businesses include (Morning Consult):
- They mistreat passengers’ luggage or personal possessions (86%)
- They have surprise fees (85%)
- You had a bad experience with them or their customer service (85%)
- They do not follow clear safety precautions (85%)
- They had a data breach and your personal information was compromised (85%)
- They are known for not being reliable (84%)
- They do not regularly clean or sanitize (84%)
- 35% of millennials say they have lost trust in a travel or hospitality brand and, as a result, will never use that brand again (Morning Consult)
- Business travelers (61%) and wealthier Americans (57%) say if they trust a brand, they go out of their way to purchase from them. This is higher than the average among adult travelers (44%) (Morning Consult)
- 8 of the 10 most trusted travel and hospitality brands are hotels or resorts, with only one airline on the list (Morning Consult)
- Overall, travelers have a higher net trust in travel brands than they did before the pandemic (Morning Consult)
- 65% of US adults say they would stop purchasing from a travel brand if it did not follow safety precautions, 62% would stop purchasing if a company failed to regularly clean (Morning Consult)
- 47% of US adults say they tend to trust travel and hospitality companies by default, only losing trust if the company does something bad (Morning Consult)
- 32% of US adults say travel and hospitality companies have to earn their trust (Morning Consult)
- 57% of all US adults say trust is a major factor in deciding on travel brands. Trust is even more important to consumers who are members of airline and hotel rewards programs (64%) and business travelers (64%) (Morning Consult)
- Why Americans travel (U.S. Travel Association):
- 85% to see my child excited about the experience
- 82% to relax/reduce stress
- 81% to make memories
- 78% for fun, excitement, and adventure
- 73% to see or do something new
- 72% to see more of the world
- 66% to strengthen relationship with a significant other
- 65% to strengthen bonds with family and friends
- 60% to improve outlook on life
- 55% to learn something new about a place, culture or history
- 40% to continue a family tradition
- 35% to cross off an item on bucket list
-
Nearly 74% of domestic trips are for leisure purposes (US Travel Association)
-
International arrivals to the U.S. totaled 79 million in 2019, about half of whom came from overseas (US Travel Association)
-
U.S. residents logged 1.9 billion person‑trips* for leisure purposes and 464.4 million person-trips* for business * Person-trip defined as one person on a trip away from home overnight in paid accommodations or on a day or overnight trip to places 50 miles or more away from home (US Travel Association)
-
U.S. residents logged 463.9 million person‑trips (one person on a trip away from home overnight in paid accommodations or on a day or overnight trip to places 50 miles or more away from home) for business purposes, with 38% for meetings and events (US Travel Association)
-
42% of people travel to visit friends/relatives, 8% for outdoor recreation purposes, 13% for entertainment/sightseeing, 15% for other pleasure/personal reasons, 3% for conventions/conferences/seminars, 7% for general business purposes and 4% for other reasons (US Travel Association)
-
1,000,000 travel-related hashtags are searched weekly. (Wex)
-
81% of travelers consider it very important for brands to provide personalized experiences to their customers (Travolution)
-
84% of Millennials and 73% of non-Millennials are likely or very likely to plan a trip based on someone else’s vacation photos or social media updates. (APM Agency)
-
37% of Millennials have had their holiday destination influenced by social media and 34% have booked a holiday because of content seen on social media. (WeSwap)
-
Leisure travelers ages 18–34 are 2.4x more likely than those ages 35 and over to discover travel destinations via mobile. (Facebook)
-
89% of Millennials plan travel activities based on content posted by their peers online. (Entrepreneur)
-
31% of Millennials said that posting holiday pics online is just as important as the holiday itself, and 29% wouldn't choose a holiday destination if they were not able to post on social media while there. (WeSwap)
-
40% of travelers post activity/attraction reviews on social media after returning home. (WebFX)
-
42% of Millennials stress about taking the perfect photo for social media during vacation (Value Penguin)
-
Top getaways travelers haven’t done before because they are too afraid, but would love to try include: volunteering trip (39%), gourmet adventure (38%), mystery trip (38%), sabbatical trip (36%), and an ancestry trip to find out about their heritage (36%) (hospitalitynet)
-
57% of travelers in the U.S. would give up alcohol for a year for a free heritage trip (Airbnb)
-
35% of travelers take vacations to try local delicacies (Booking.com)
-
51% of people travel to recharge their batteries when they feel stressed, busy, and tired (Intrepid Adventure Travel Index)
-
59% of solo travelers said the reason they travel alone is because they want to see more of the world and they’re not willing to wait for others (Solo Traveler)
-
45% of solo travelers like the freedom to do what they want when they want while traveling (Solo Traveler)
-
47% of millennials and 40% of generation Z travel to relax and avoid stress (WYSE Travel Confederation)
-
55% of generation z travel to increase their knowledge (WYSE Travel Confederation)
-
23% of millennials travel to meet other travelers (WYSE Travel Confederation)
-
45% of millennials travel to learn more about themselves (WYSE Travel Confederation)
-
56% of global travelers agree traveling has taught them invaluable life skills (Booking.com)
-
One in two (55%) travelers think the best thing about travel is getting out of their comfort zone (hospitalitynet)
-
34% of younger millennials travel to find more excitement in life (Expedia)
-
One in five people plan to take health and well-being trips (Yoga and Meditation Retreats, Weight Loss and Fitness Retreats, etc.) in 2018, almost double the amount of people compared to 2017 (Booking.com)
-
46% of families have taken their children on trips for family reunions (NYU)
-
95% of family travelers said their priority was keeping their families entertained and happy (Short Term Rentalz 2019)
-
89% of family travelers said their priority was deals and value of the vacation (Short Term Rentalz 2019)
-
85% of family travelers said their priority was planning travel around school holidays (Short Term Rentalz 2019
-
85% of families said their priority was was outdoor activities (Short Term Rentalz 2019)
-
85% of families said their priority was being near major attractions or theme parks (Short Term Rentals 2019)
-
49% of families said their main priority when they take a family vacation is to visit new places and explore together, 42% to relax and unwind together, and 6% to be active and outdoors together (NYU)
-
45% of global travelers start their booking process by deciding on a specific destination (Trip Advisor)
-
59% of pre-travel research takes place between one and three months before traveling (Trip Advisor)
-
86% of travelers use online resources when deciding on their accommodation (Trip Advisor)
-
73% of travelers use online sources when deciding on their destination (Trip Advisor)
-
77% of families said that “best value/price for our budget” was the most important factor when deciding where to stay on vacation (NYU)
-
28% of Millennials trust social media about travel providers over magazines, television and Google and TripAdvisor reviews. (WeSwap)
-
49% of travelers won’t book a hotel without reviews (Statistic Brain)
-
25% of families had used a travel agent and 75% hadn't for their family vacations in the past five years (NYU)
-
59% of families said travel websites (TripAdvisor, Expedia, etc.) were resources they used for information or inspirations for where to go and what to do, 10% said Instagram, 74% said search engines, 51% said travel review websites, 30% said social media, 12% said travel agents, and 8% said blogs (NYU)
-
58.2% of travelers used any user-generated content to help plan their leisure travel, 32.5% used reviews from hotel, 29.6% used travel reviews of destinations, 30.8% used reviews of restaurants or activities, 13.5% used travel itinerary or blogs, 33.3% used Facebook and 26.3% used group discount websites (Destination Analysts)
-
56% of solo travelers said the top factor they look for in a destination is safety (Travel Agent Central)
-
More than 40% of business trips in the past year have included a leisure portion added on (Expedia Media Solutions)
-
25% of Americans who travel for a business trip will extend the trip for personal travel (AARP)
-
64% of Millennials prefer booking on travel websites for hotels, 47% prefer booking through specific hotel, resort and airline websites, and 24% prefer to book through travel agents (Resonance Consultancy)
-
79% of travelers who use a smartphone complete a booking after researching on their smartphones (Think With Google)
-
65% of hotel bookings were made on the same day as researching on a smartphone (Statistic Brain)
-
33% of Americans would go on at least one additional summer road trip if gas prices remain low (AAA)

Travel Activities: What People Do When They Travel
- The most popular types of vacations this year are: (Booking.com, 2023)
- Nostalgic getaways (88%)
- Blowing the budget (80%)
- Laid back luxe life (78%)
- Getting out of comfort zone (73%)
- Nightlife-centric vacations (72%)
- Adventure backpacking (70%)
- Wilderness survival (67%)
- 29% of travelers are planning a cruise in the next year (Morning Consult, 2023)
- 48% of travelers say they trust cruise companies (Morning Consult, 2023)
- 83% of travelers want to shop at small businesses when they travel to a new location (American Express, 2023)
- 88% of travelers believe that dining and shopping at local small businesses brings a more authentic experience (American Express, 2023)
- 81% of travelers most look forward to trying local foods while traveling (American Express, 2023)
- 37% of travelers planned an entire trip around visiting a specific restaurant and 35% have planned a trip around attending a food festival (American Express, 2023)
- 66% of travelers want their trips to be strictly work-free in 2023 (Booking.com, 2023)
- 61% of travelers want to visit a theme park in 2023 (Booking.com, 2023)
- 82% of travelers enjoy walking as their favorite activity to stay healthy while walking (American Express, 2023)
- 72% of travelers are more focused on self-care than they were a year ago (American Express, 2023)
- 57% of travelers plan to take an extended vacation to focus on wellness (American Express, 2023)
- 89% of people taking an incentive trip ranked ample time for relaxation as the most important quality of incentive travel (The IRF, 2023)
- 52% of credit card loyalty programs offer tours and activities redemption, 37% offer live events redemption, 19% offer dining redemption and 15% offer wellness redemption (iSeatz, 2023)
- Increased attendance at live events is the number one driver of increased business travel in 2023, followed by the easing of travel restrictions and the reopening of their own offices (Deloitte, 2023)
- 50% of travelers want to experience culture shock in 2023 (Booking.com, 2023)
- Half of leisure travelers are at least somewhat interested in taking a cruise in the next 12 months (MMGY)
- 41% of US travelers are seeking excitement/exhilaration on their next trip (Expedia)
- 11% of travelers are willing to try daring or high-adrenaline activities (Expedia)
- 24% of travelers are looking for an unforgettable night out (Expedia)
- 21% of travelers are most excited to try experiences they would usually never do, like: sleeping under the stars (19%), travelling alone (17%), skinny-dipping (11%) or having a vacation romance (10%) (Expedia)
- 61% of travelers are most interested in outdoor activities (like hiking, biking and kayaking) and wellness/relaxation experiences (Evolve)
- Travelers over 40 are more likely to travel with a significant other or multiple generations of family. Travelers under 40 are more likely to travel with a group of friends or solo (Evolve)
- When planning trips for 2022, US travelers feel that “new” is important: (Trip Advisor)
- Seeing new places (75%)
- Having new experiences (71%)
- Going out to restaurants/trying new food (69%)
- Meeting new people (35%)
- 34% of American travelers said it’s more important now than before the pandemic that they choose a destination where they can immerse themselves in “authentic local experiences” (Trip Advisor)
- 30% of American travelers said it’s more important now than before the pandemic that they pack as many activities into their vacation as possible (Trip Advisor)
- 34% of American travelers will visit a beach in 2022, 13% will go on shopping trips, 18% will go camping or glamping, 12% are planning a foodie or wine tasting tour and 6% are planning a spa trip or wellness retreat (Trip Advisor)
- About 20% of travelers worldwide plan to take more guided cultural activities than they did in previous years (Trip Advisor)
- 30% of American travelers are planning more self-guided cultural activities and 22% are planning more guided cultural activities than they did in previous years (Trip Advisor)
- 45% of Americans said they’re looking to experience something new and unique on their next trip (Trip Advisor)
- The top five trending experience categories Americans are booking for spring 2022 include: 4WD, ATV & off-road tours, day trips, cultural tours, snorkeling and wine tasting/winery tours (Trip Advisor)
- When booking hotels, the top 3 amenities travelers searched for were: pool, bar/lounge and restaurant (Trip Advisor)
- 44% of travelers are interested in road trips, 39% in beach trips and 30% in shopping trips (Trip Advisor)
- 72% of travelers are excited to return to amusement parks after the pandemic, 68% to movie theaters, 67% to bars/clubs, 79% to concerts and 74% to sporting events (Cardify)
- Top leisure travel activities for U.S. domestic travelers: (1) visiting relatives; (2) shopping; (3) visiting friends; (4) fine dining; and (5) rural sightseeing (US Travel Association)
-
67% of high-income travelers said they would rather spend their vacation money on activities than a nicer hotel room (Skift)
-
Domestic travelers spent 17% of their budgets on recreation/amusement (US Travel Association)
-
65% of travelers visited art/history museums, 59% aquariums, 56% science museums, 55% theme parks, and 55% zoos in 2017 (MMGY Global)
-
34% of those who travel want to visit a world famous theme park (Booking.com)
-
54% of travelers go shopping during their summer vacation, 49% visit historical sights, 49% go swimming or do water sports, 46% go to a park or national park, and 46% go on sightseeing tours (Statistic Brain)
-
73% of travelers with children have taken their children to theme parks on vacation (NYU)
-
21% of travelers who use social media for inspiration when researching trips are looking for info on attractions. (WebFX)
-
11 million Americans take a cruise each year (Value Penguin)
-
Sunset cruise excursions have gone up by 89% in bookings since 2017 (TripAdvisor)
-
Snorkeling activities have gone up by 64% since last year (TripAdvisor)
-
Sailing trips have gone up by 55% within the last year (TripAdvisor)
-
Since 2017, catamaran cruises have gone up by 51% (TripAdvisor)
-
Kayaking and canoeing experiences have gone up by 49% since last year (TripAdvisor)
-
33% of travelers will visit a spa or receive beauty treatments (Booking.com)
-
15% of travelers will attend meditation/mindfulness retreats (Booking.com)
-
73% of travelers aged 25-34, travel to see the top sights (Solo Traveler)
-
50% of travelers aged 25-34, go to museums while on vacation (Solo Traveler)
-
Those who get tickets to watch athletic events while on vacation pay about $180 annually while those who play sports, like golf, while on vacation, spend about $640 per year (Value Penguin)
-
Average entertainment costs, if incurred by vacationing households: $640 for participant sports, $541 for movies and other admissions, $180 for tickets to sporting events, $250 for other recreation expenses and $250 for other entertainment services (Value Penguin)
-
Travel activities account for 8% of U.S. travel gross bookings and the segment comes in third by size behind hotels and flights (Phocuswright)
-
The U.S. travel activities market totaled $34 billion in 2018, and growth is outpacing the total travel market (Phocuswright)
-
More than three in four activities booked in-destination happened on the day of or day before the activity (Phocuswright)
-
Mobile searches for “things to do/activities” + “near me” have seen a 6X increase over the last two years. (Think with Google)
-
Searches for activities are happening across devices in the three months prior to a trip, but shift significantly to 54% mobile when travelers are in-destination (Google)
-
35% of travelers have used mobile phones to book a tour or activity while already at a vacation destination (Skift)
-
Travelers tend to book expensive activities more in advance compared to cheaper activities (Tour Scanner)
-
50% of activity bookings are made less than eight days before consumption. (Tour Scanner)
-
85% of consumers use their phones to book travel activities, including restaurant reservations and sightseeing tours. (MDG Advertising)
- It’s predicted that the overall tours and activities segment will grow to $183 billion (Phocuswright)

Other Travel Statistics
- 77% of travel businesses operate a loyalty program (Expedia, 2023)
- 44% of consumers belong to a travel loyalty program (Expedia, 2023)
- 61% of female and 58% of male travelers now pay more attention to travel discounts offered through loyalty programs than they did before the pandemic (Booking.com, 2023)
- Experts predict the number of people participating in incentive travel programs will increase by 48% in 2023 and 61% in 2024 (The IRF, 2023)
- 46% of all U.S. adults are members of a travel loyalty/rewards program, with millennials the most likely to be members (56%) (Morning Consult, 2023)
- 84% of high-income earners are members of a travel loyalty/rewards program (Morning Consult, 2023)
- 61% of travelers plan to redeem points or rewards for travel in the next 6 months, of which 7% plan to redeem in the next month (Morning Consult, 2023)
- Members of travel loyalty programs most value getting the following perks of membership: (Expedia, 2023)
- Special discounted pricing (52%)
- Collecting points to redeem for future purchases (46%)
- Complimentary upgrades/add-ons (42%)
- Exclusive access to amenities and services (34%)
- Prioritized customer service (26%)
- 53% of travelers say it is more important now than it was before the pandemic to stay with providers where they are a loyalty member (Expedia, 2023)
- Among people with business travel planned in the next three months: (Morning Consult, 2023)
- 48% plan to stay at a chain hotel
- 32% plan to stay with family and friends
- 28% plan to stay in a vacation rental
- 55% plan to travel with their own car
- 44% plan to travel by plane
- 21% plan to travel by bus
- 16% plan to travel by train
- Air travel demand in April 2023 rose 10% over April 2022, bringing it to equal April 2019, the last pre-pandemic year (US Travel Assoc, 2023)
- Hotel stay demand in April 2023 rose 2% over April 2022, but is still 2% below April 2019 levels, the last pre-pandemic year (US Travel Assoc, 2023)
- Overseas arrivals into the U.S. in April 2023 dropped 27% from April 2022, and are still 27% below April 2019 levels, the last pre-pandemic year (US Travel Assoc, 2023)
- Globally, 35% of travelers plan to stay in 1- to 3-star hotels in 2023 (Expedia, 2023)
- Demand for vacation rental private homes in U.S. western destinations is up by more than 30% (Expedia, 2023)
- 43% of travelers say that saving money is what they value most from their loyalty programs (iSeatz, 2023)
- 32% of loyalty program providers include travel awards as part of their earning and redemption options (iSeatz, 2023)
- 61% of travelers believe their loyalty programs are helping them save money and get more value from travel experiences (iSeatz, 2023)
- Loyalty providers reported their top goals for 2023 as increasing membership (59%), boost engagement (59%), increase customer lifetime value (40%), increase participation and total spend through the loyalty program (39%) and introduce new rewards and earn/burn options (39%) (iSeatz, 2023)
- 86% of loyalty programs with travel rewards have booking capabilities (iSeatz, 2023)
- 29% of loyalty programs with travel booking capabilities describe their program as “state of the art” (iSeatz, 2023)
- 25% of consumers dislike that they can’t book all travel options they want in one place with their loyalty program (iSeatz, 2023)
- 24% of consumers have a hard time understanding their travel loyalty program’s earning and redemption rules (iSeatz, 2023)
- 59% of consumers would engage more with their loyalty program if given deeper discounts, 31% if given more exclusive options, 25% if given a better booking experience and 40% if given a broader selection of rewards (iSeatz, 2023)
- 81% of gen z like personalize ads, 57% of millennials do not prefer personalized ads (iSeatz, 2023)
- 37% of consumers receive personalized recommendations via their loyalty program booking site (iSeatz, 2023)
- 31% of consumers say they would likely use a buy now, pay later option if offered by their travel loyalty program, 27% would likely use price/fare freezing, 16% would use digital wallet acceptance and 5% would use cryptocurrency acceptance (iSeatz, 2023)
- 36% of millennials and 44% of gen z would be more likely to book a trip through their loyalty program if the provider contributed a portion to sustainability causes (iSeatz, 2023)
- 44% of consumers would be more likely to book sustainable travel options if given a bonus or incentive for doing so (iSeatz, 2023)
- 31% of consumers want their travel rewards provider to add buy now, pay later options, with millennials and gen z being the most likely to want this at 53% (iSeatz, 2023)
- 63% of loyalty providers believe they are their members’ first choice when booking travel (iSeatz, 2023)
- 51% of consumers visit their loyalty program website first when booking travel (iSeatz, 2023)
- 20% of travel loyalty program providers say user experience is their biggest challenge (iSeatz, 2023)
- 92% of travel loyalty program providers believe they are delivering on their members’ needs, only 52% of members agree (iSeatz, 2023)
- 84% of consumers got frustrated by user experience issues when booking travel through their loyalty program (iSeatz, 2023)
- 40% of businesses are working to optimize their corporate travel policy to decrease environmental impact (Deloitte, 2023)
- 54% of travelers plan to take more trips this year than in 2022 (Hopper, 2023)
- 63% of hotel bookings through the Hopper app in 2023 were made for same-day check-in (Hopper, 2023)
- 53.6% of travelers are taking more trips in 2023 than previous years, 32.7% are taking the same number of trips and 13.7% are taking fewer trips (Hopper, 2023)
- 45% of travelers have some level of travel flexibility because of remote work (Hopper, 2023)
- Because of work flexibility, 57% of travelers are traveling more frequently, 30% are traveling more during the school/work week, 26% are traveling for longer and 19% are working and traveling as a digital nomad (Hopper, 2023)
- 52% of travel professionals are making changes to their business due to negative customer reviews (Expedia, 2023)
- 96% of travel organizations say they offer refundable services or credits, while only 63% say they will continue providing these moving forward (Expedia, 2023)
- Only 8% of travel industry professionals say leisure travel is back to pre-pandemic levels, but 63% expect it to return in the next 2 years (Expedia, 2023)
- 46% of consumers say travel is more important to them now than it was pre-pandemic (Expedia, 2023)
- 1 in 3 consumers are planning an upcoming business trip (Expedia, 2023)
- 79% of consumers plan to take a leisure trip in the next year (Expedia, 2023)
- US airlines are projecting 150% as many passengers to fly in 2022 as did in 2021 (IATA)
- 3.4 billion passengers are projected to fly in 2022, up from 2.3 billion in 2021, but still down from 4.5 billion in 2019 (IATA)
- In 2022 overall demand for flights is expected to reach 61% of pre-crisis (2019) levels. Capacity is expected to continue to increase faster than demand, reaching 67% of pre-crisis levels for 2022 (IATA)
- In 2022, demand for domestic flights is expected to reach 93% of pre-crisis (2019) levels (IATA)
- In 2022, demand for international flights is expected to reach 44% of pre-crisis (2019) levels (IATA)
- Air travel in January 2022 (measured in RPKs) was up 82.3% compared to January 2021, but down 4.9% compared to the previous month (December 2021) (IATA)
- January 2022 domestic air travel was up 41.3% compared to January 2021, but down 7.2% compared to December 2021 (IATA)
- January international air travel was up 165.6% compared to January 2021, but down 2.2% compared to December 2021 (IATA)
- Hotel demand in January 2022 was 9% below 2021 levels (US Travel)
- Nearly 1 in 6 job openings in the US are in leisure and hospitality (US Travel)
- Overseas arrivals fell to 65% below 2019 levels in January 2022 (US Travel)
- Leisure & hospitality accounts for 61% of all jobs still lost since 2020, and is recovering more slowly than the rest of the economy (US Travel)
- Of the 10.9 million job openings in the US at the beginning of 2022, roughly one in six, or 1.7 million, were in leisure & hospitality alone (US Travel)
- 58% of tourism professionals predict a travel rebound in 2022 (mostly in the third quarter) and 42% predict the rebound won’t happen until 2023 (UNWTO)
- 64% of tourism experts predict international arrivals will return to pre-pandemic levels in 2024 or later (UNWTO)
- 2020 was the worst year on record for tourism and 2021 the second worst year on record (UNWTO)
- US adults say travel brands should definitely take these precautions: (Morning Consult)
- clean/sanitize common areas (71%)
- clean/sanitize private customer areas (70%)
- publicly share info about COVID-19 protocols (55%)
- allow for physical distancing (49%)
- require employees to wear masks (48%)
- require customers to wear masks (41%)
- use tech to minimize interactions (39%)
- The most popular travel dates for spring 2022 are March 31, March 11 and then March 12 (Trip Advisor)
- 77% of Americans say they’ll travel within the US between March and May 2022, and 23% plan to travel internationally (Trip Advisor)
- 78% of US travelers intend to travel during 2022 (Trip Advisor)
- By the end of 2021, 78% of Americans were ready to travel (US Travel)
- By the end of 2021, 81% of global business travelers believed their 2022 domestic business travel volume could meet or exceed their pre-pandemic volume (US Travel)
- There is a 1 in one million risk of an infected passenger transmitting COVID-19 to another passenger flying from the UK to the US (US Travel)
- International travel restrictions resulted in the loss of more than 1 million American jobs and $150 billion in export income in 2021 (US Travel)
- In March 2020, international visitations were down 96% compared to March 2019 as a result of pandemic lockdowns on travel (US Travel)
- In the year 2020, international travel to the US fell by 76% compared to 2019 (US Travel)
- Prior to the pandemic, direct travel jobs accounted for 6% of the workforce and total travel-supported jobs accounted for 11% (US Travel)
- In 2020, direct travel jobs accounted for 35% of jobs lost and total travel supported jobs accounted for 65% of jobs lost (US Travel)
- 62% of travel and hospitality companies offer email support, 46% have Twitter profiles. Only 12% of travel companies are responsive via both email and social support (Netomi)
- From the travel and hospitality companies that offer support, 70% of emails and 46% of Twitter direct messages are never answered (Netomi)
- When travel and hospitality companies offer customer support, 97% of email responses do not provide a meaningful answer in the initial email response and 72% of companies don’t provide a relevant response on social media (Netomi)
- When travel and hospitality companies answer customer inquiries, 57% respond to emails within the first 3 hours, and 22% respond within the first 15 minutes on Twitter (Netomi)
- Only 11% of travel and hospitality companies show empathy in email responses and 26% don’t show any empathy on social media support (Netomi)
- The largest travel and hospitality companies (5,000+ employees) were the slowest responders on email, with an average response time of over 27 hours, but the quickest on Twitter, responding to social messages in 5.8 hours, on average (Netomi)
- 65% of Americans are look forward to traveling again, both internationally and domestically, after COVID-19 restrictions are lifted (Zapwater)
- 56% of those surveyed said they feel comfortable spending just as much on a trip as they would have before COVID-19 (Zapwater)
- Post COVID travel priorities include: hotel safety protocols (76%) close proximity to home (23%) and the number of COVID-19 cases in a destination (63%) (Zapwater)
- Once COID-19 restrictions are lifted, 61% of Americans will plan their first trip to visit family and friends (Value Penguin)
- Once COID-19 restrictions are lifted, the first states Americans want to visit include Florida (13%), California (12%) and New York (8%) (Value Penguin)
- 19% plan to spend less on travel due to financial impacts of COVID-19 restrictions, while 15% expect to spend more and 42% expect to spend the same as usual (Value Penguin)
- 72% of Americans did not take a 2020 summer vacation due to COVID-19 concerns (Value penguin)
- A third of Americans (50% of parent with children under 18) put off a milestone trip such as an anniversary or graduation celebration in 2020 (Value penguin)
- In 2020, those with more money were more likely to take a summer vacation: 52% of households earning $100,000 or more, 36% of households earning $75,000 to $99,000 and only 15% of households earning less than $25,000 (Value penguin)
- 31% of consumers (49% of parents with kids under 18) decided to take a summer staycation in 2020 (Value penguin)
- 36% of working Americans who took no paid time off in the summer of 2020 reported it was because they had nowhere to travel to (Value penguin)
-
Most families own or lease the vehicles they use for road trips, but about 2% rent a car or truck on vacation and spend an average of $1,223 (Value Penguin)
-
Despite their cultural prominence, only 0.5% of Americans travel via RV (recreational vehicle) (Value Penguin)
-
Travel website cart abandonment rates are 81.6% which is higher than the overall average of 76.8%. (SaleCycle)
-
Booking abandonment rates on hotel websites are 78.3%, with the most common reasons around research and price comparison (IMPACT)
-
Only about 10% of Americans buy a plane ticket in a given quarter (Value Penguin)
-
The U.S. travel market grew 5% in 2018, with gains remaining steady in 2019; by 2022, total gross bookings will have increased to $441 billion (Phocuswright)
-
66% of bookings were made through supplier websites/mobile apps, and 34% through OTAs (Phocuswright)
-
90% of travelers now have apps to make their life easier when at their destination with maps, airlines, weather and social media (Travelport)
-
55% of global travelers report being more determined to make sustainable travel choices than they were a year ago (Booking.com)
-
73% of global travelers intend to stay at least once in an eco-friendly or green accommodation when looking at the year ahead (Booking.com)
-
70% of global travelers say they would be more likely to book an accommodation knowing it was eco-friendly, whether they were looking for a sustainable stay or not (Booking.com)
-
More than 60% of travelers would consider an impulse trip based on a good hotel or flight deal (Think With Google)
- Booking.com found that 80% of customers prefer mobile booking to get the information that they need (TechRadar)
- For those going abroad, 31% have booked their 2019 trips by September of 2018 (AARP)
- 72% of all mobile bookings made by travelers happened within a 48-hour window prior to booking (Sojern)
- 38% of all mobile bookings are made on the same day or two days before a trip (PhocusWright)
- 53% of all mobile bookings are made within a week of a trip (PhocusWright)
- Only 19% of all mobile bookings are made more than a month in advance (PhocusWright)
- 32% of solo travelers start planning 6 months before departure (Solo Traveler)
- 33% of solo travelers start planning 3 months or less before departure (Solo Traveler)
- 40% of global travelers choose to stay in eco-friendly places to help reduce environmental impact, 34% to have a locally relevant experience, and 33% to feel good about an accommodation choice (Booking.com)
-
Plane and car are preferred modes of transport for family travel, with 52% selecting their mode of transport by the fastest option, and 34% based on lowest cost (Expedia Group)
-
The primary mode of transportation for domestic and international travel are: plane (66% domestic & 87% international), cruises (5% domestic & 35% international), train (6% domestic & 16% international), rental car (24% domestic & 14% international), personal car (60% domestic & 13% international), and buses (2% domestic & 10% international) (AARP)
- 6% of travelers end up paying for local transportation, like taxis, as part of their yearly vacation budget (Value Penguin)
-
About 6% of families travel by train, bus or ship on vacation (Value Penguin)
- 61% of families stay in a hotel while on vacation with children and 22% stay in a resort (NYU)
- 37% of travelers go on road trips on Independence Day, 29% on Memorial Day, and 27% on Labor Day (Statistic Brain)
- Airbnb had 80 million bookings by guests in (Resonance Consultancy)
- 26% of ages 18-34 used a train during their vacation (Trip Advisor)
- 88% of travelers have already selected their domestic travel destination for 2019 (AARP)
- More Millennial's than Baby Boomers will use all of their vacation time (77% versus 62%) (AARP)
-
There are 705 million total unused vacation days annually (U.S. Travel Association)
-
52% of American employees have unused vacation time (U.S. Travel Association)
-
Americans took an average 17.2 vacations in 2017 (U.S. Travel Association)
-
212 million vacation days get forfeited annually (U.S. Travel Association)
-
Millennial's are more likely to bring work with them on trips than Baby Boomers (78% versus 59%) (AARP)
- 82% of millennials consider travel reviews important (Internet Marketing Inc.)
-
The proportion of mobile bookings increased between 2017 and 2018, from 51.5% to 56.7% (TrekkSoft)
-
51% of US travelers said that once they decided to go on a trip, they would spend less than one week researching flights (Facebook IQ)
- 54% of family travelers prefer taking a plane for transportation to their destination and 47% prefer cars (Short Term Rentalz 2019)
- 60% of family travelers prefer hotels for accommodation, 21% prefer resorts, and 17% prefer to stay with family and friends (Short Term Rentalz 2019)
-
Hotels and flights are booked in advance of 12 weeks and within the 3 months prior to the trip date (Google)
-
48% of experiences are booked once travelers arrive at their destination (Google 2019)
-
Gen Alpha (those born after 2010) is showing more signs of influencing family travel decisions and planning (Short Term Rentalz)
-
On average globally, travelers with Gen Alphas are taking more than three family trips a year (Expedia Group)
-
Online will account for the lion’s share of travel sales at 52%, with mobile sales representing a quarter of all travel bookings (Euromonitor International)
-
International arrivals are expected to amount o 1.8 billion trips by 2024, and domestic tourism is expected to reach 19 billion (Euromonitor International)
-
74% of consumers say experiencing things in the real world was a priority for them in 2019, with Baby Boomers being the most experiential and Gen Z being less so by 15% (Euromonitor International)
-
43% of global consumers say they prioritize experiences over things, while 78% value real world experiences in 2019 (Euromonitor International)
- Where the average employee is taking 17.2 days of vacation, 47% of that time - just eight days - is used for travel (U.S. Travel Association)
- 23% of employees said they used none of their time off to travel (U.S. Travel Association)
- 84% of employees say it is important to them they use their time off to travel (U.S. Travel Association)
- The average Millennial takes 14.5 days off, 7.1 of which are used to travel (U.S. Travel Association)
- Gen X uses 17.9 of their days off and dedicates 8.2 of those for travel (U.S. Travel Association)
- Boomers take the most days off work at 19.8 and spend 9 days on travel vacations (U.S. Travel Association)
- 48% of Americans don’t use a majority of their vacation time for travel (U.S. Travel Association)
- Mega-travelers are happier with how they spend their paid time off compared to homebodies (76% to 48%) (U.S. Travel Association)
- When it comes to happiness with physical health and well-being, there is a 22% gap (61% to 39%) between mega-travelers and homebodies (U.S. Travel Association)
- 59% of mega-travelers report being happy with their company, compared to 46% of homebodies (U.S. Travel Association)
- 57% of mega-travelers reported being happy with their job compared to 46% of homebodies (U.S. Travel Association)
- 52% of mega-travelers reported receiving a promotion in the last two years compared with 44% of Americans who use some or little to none of their time to travel (U.S. Travel Association)
- Employees who used little to none of their vacation time for travel were 5% less likely than those who use all or most of their vacation time for travel to report a raise or bonus in the last three years (81% to 86%) (U.S. Travel Association)
Got Travelers of Your Own?
We at Access Development know a thing or two about wholesale travel benefits and the white-label travel platforms used to increase member engagement. Contact us and learn about our private travel network for groups and organizations. Whether it's deep discounts or cash-back travel rewards of up to 50% on hotel bookings, car rentals, theme park tickets and more, Access has the platform you need to offer your travelers unparalleled worldwide value.

Topics: Customer Engagement, Customer Incentives, Member Benefits, Travel, value enhancement, travel club incentives, tourism statistics, vacation statistics, business travel statistics, travel statistics


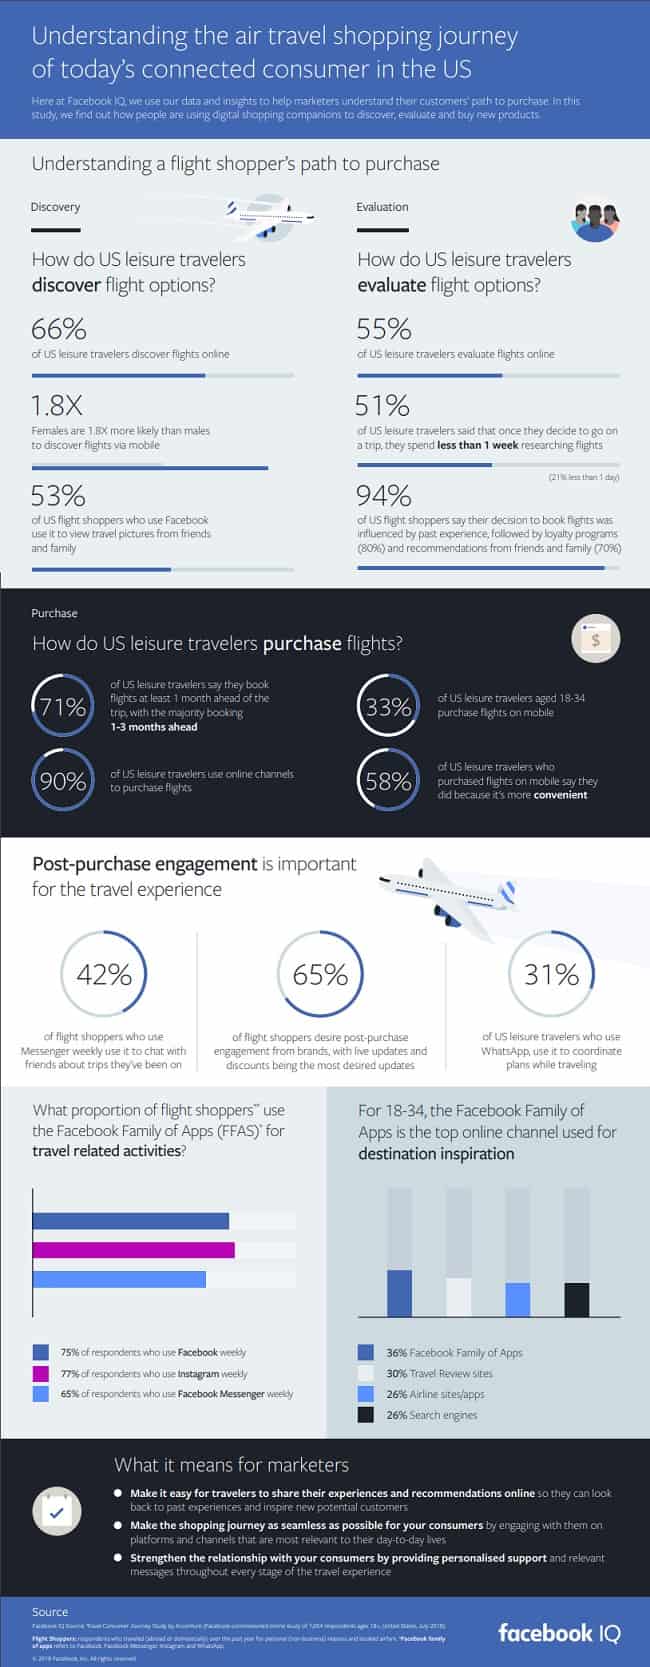
Share your Comment.