
 Brandon Carter
Update: Looking for newer statistics? Check out our 2019 collection here.
It's a new year, and as Bob Dylan warned us way back, the times are a-changin'. In the world of consumer preferences, things are a-changin' by the nanosecond it seems. It's a load to keep up with. To help you stay abreast of this ever-changing world in which we live, we're collecting every relevant customer loyalty statistic we can find that's released in 2015.
These statistics are generated by research firms, loyalty and rewards firms, retailers, and more. That means sometimes the statistics can be skewed, and often one statistic will conflict with another. For you suspicious minds out there, we'll provide a direct link to the research so you can decide for yourself.
Want more? Be sure to check out our ultimate collection of loyalty statistics for these stats as well as others from the past few years. Needing even more? We have collections of Millennial loyalty stats, employee engagement and loyalty stats and coupon stats.
- 2015 Consumer Loyalty Statistics
- 2015 Bank & Financial Loyalty Statistics
- 2015 Travel Loyalty Statistics
- 2015 Loyalty Program / Loyalty Marketing Statistics
- 2015 Retail Loyalty Statistics
- 2015 Restaurant Loyalty Statistics
 If you have research you'd like us to share, please leave us a note in the comments. Boomark this page and check back often. We will update the page frequently throughout 2015, as more and more research is released.
2015 Consumer Loyalty Statistics
- 28% of consumers are loyal to their providers and brands (Accenture)
- 45% of consumers maintained a consistent level of loyalty to the top 100 CPG brands in the U.S. from 2014-15 (Catalina)
- 73% of consumers cite price and value as the leading factor that determined brand loyalty (Support.com)
- 66% of consumers cite features, design and quality of product or service as the leading factor that determined brand loyalty (Support.com)
- While 89% of consumers agree that good service makes them feel more positive about the brands they engage with, 48% also said they are suspicious about how their data is used (Verint)
- Top 3 reasons consumers switch brands: cheaper pricing (31%), rude staff (18%) and too many mistakes (16%) (Verint)
- 61% of consumers would tell friends and family about their experiences, while 27% reported that they would sign up to the company's loyalty scheme (Verint)
- Only 15% of consumers don't think good service would change their behavior in any way (Verint)
- 38% of marketers say their biggest 2015 challenge is improving customer acquisition and retention (TeraData)
- 29% of B2B customers are fully engaged (Gallup)
- Top companies that have earned consumer loyalty are: USAA, H-E-B, Publix, Trader Joe’s, Apple, JetBlue Airlines, Aldi, Hy-Vee, Amazon.com, Chick-fil-A, Victoria Secret, ACE Rent A Car, A credit union, Kroger, QVC, Popeye’s, Whole Foods, Panera Bread, Lexus, Papa John’s, Costco & Wegmans (Temkin Group)
- Top brands that best meet Millennial consumers’ expectations and, therefore, to which Millennials are most engaged and loyal, are: Apple, Nike, Chipotle, Target, Amazon, Samsung, Sephora, Levi’s, PayPal, Old Navy, Under Armour, Beats, Google, Asus, Chevrolet, Converse, Verizon, Victoria’s Secret, Ford and Ralph Lauren (Brand Keys)
- 62% of millennials feel that online content drives their loyalty to a brand (NewsCred)
- The most important driver of brand loyalty for millennials is a great product at 77%, followed closely by brand recognition and trust at 69% (NewsCred)
- 31% of consumers are willing to recommend providers and brands to others (Accenture)
- The potential revenue up for grabs due to changes in consumer spending and switching among brands and providers is $1.6 trillion, a 29% increase from 2010 (Accenture)
- 56% of U.S. consumers said the number of brands they consider for a given product or service has increased significantly over the past 10 years (Accenture)
- 46% of U.S. consumers said they’re more likely to switch providers than they were 10 years ago (Accenture)
- % of unfavorable customer opinions on social media by industry: Telecom (96%), Consumer Electronics (94%), Retail (93%), Airlines (88%), Hotel Chains (72%) (Cap Gemini)
- Top 3 customer frustrations: failure to quickly resolve an issue, lengthy hold times, and interacting with representatives who cannot provide a solution (Accenture)
- Avis had the highest level of consumer engagement for the Car Rental category (Brand Keys)
- “Fully engaged” customers (those with a strong attachment to the brand, or brand ambassadors) deliver a 23% premium over the average customer in share of wallet, profitability and revenue (Cap Gemini)
- “Actively disengaged” customers (those who have negative feelings towards the brand, or spread negative word-of-mouth) represent a 13% discount in share of wallet, profitability and revenue (Cap Gemini)
- 44% of millennials say they are loyal to brands they buy, and 52% will choose quality over price (IRI)
- 76% of American shoppers view customer service as a "true test" of how much a brand values them (Aspect Software)
- 82% of U.S. corporate executives said that customers’ expectations of their company were “somewhat” (47%) or “much” (35%) higher than they were three years ago (Lithium)
- Nearly 6 in 10 U.S. corporate executives said it was “somewhat” (50%) or “very” (9%) difficult for their company to please customers (Lithium)
- 77% of corporate execs agreed to some extent that the internet and consumer app companies were setting a new benchmark for customer experiences (Lithium)
- 93% of business leaders worldwide said technology had changed customer expectations in the past five to 10 years (EMC)
- 97% of U.S. corporate executives say customers want an efficient—that is, fast, cost-effective and personalized—level of experience (Lithium)
- 65% of corporate execs said rising customer expectations had increased pressure to innovate, and 58% said the same about competition with other companies (Lithium)
- 30% of corporate executives struggled with customer turnover or slowed revenue growth, and a similar percentage had increased discounts given (Lithium)
- 55% of millennials were willing to stick with a brand (Lim College)
- What brands can do to remain millennials' brand of choice: develop innovative new products and services (80%), improve design/style to reflect uniqueness (74%), improve product quality (67%), engage in causes, philanthropy, or endeavors that reflect beliefs/values (63%) & limit distribution to maintain the brand's exclusivity (54%) (Lim College)
- 66% of millennials may have abandoned what had been their brand of choice in 2013 because the brand no longer fit their identity, 66% had a simple desire to switch brands, 64% due to the availability of desirable new alternatives and 64% because the brand was no longer unique (Lim College)
- Millennials are not loyal to fashion brands. 45% of those surveyed say nothing can be done to retain them (Lim College)
- 65% of all consumers say they feel good about themselves and the company they are doing business with when they resolve a problem without talking to customer service (Aspect Software)
- 69% of Millennials say they feel good about themselves and the company they are doing business with when they resolve a problem without talking to customer service (Aspect Software)
- 56% of Millennials have switched brands in the past year because of poor customer service (Aspect Software)
- Frequency of interaction builds loyalty and advocacy: 87% daily, 64% weekly, 49% monthly and 33% few times/year (Strativity)
- Leading business concerns among US small business owners: finding new customers (66%) & retaining existing customers (40%) (Constant Contact)
- For every customer experience failure, brands lose an average of 65% of the revenue they would have earned from the affected customer during the following year (SDL)
- Once a customer experiences what they consider a major customer experience failure, 64% will stop recommending the organization, start looking for an alternative brand or actively disparage the company via word of mouth, social media or other online channels (SDL)
- 90% of those experiencing a customer failure spend the same or less with the brand during the following year. The 10% who spend more say they have no choice, being locked into a contract or have no other alternative (SDL)
- While 30% of consumers say showing them how the business has improved as a result of their failure will bring them back to the brand, this only works for 8% (SDL)
- 27% of young millennials will not try to resolve a customer experience failure, as compared to 13% of baby boomers (SDL)
- More than 40% of consumers' worst customer experiences have occurred in digital industries, including communications, electronics and online retail (SDL)
- Consumers are more likely to remember a negative experience than a positive one: of those consumers that can recall a major negative customer experience that occurred in the past 10 years, only 55% can recall a major positive customer experience occurring in the same timeframe (SDL)
- Millennials are 44% more likely to permanently disengage with brands if they receive high volumes of mass generic email communications (Aimia Institute)
- 66% of global respondents are willing to pay more for products and services from companies dedicated to social and environmental change (Nielsen)
- 73% of Millennials are willing to pay extra for products and services from companies dedicated to social and environmental change (Nielsen)
- 51% of Boomers are willing to pay extra for products and services from companies dedicated to social and environmental change (Nielsen)
- 72% of Gen Z are willing to pay extra for products and services from companies dedicated to social and environmental change (Nielsen)
 2015 Bank & Financial Loyalty Statistics
- 46% of Millennials look for new financial companies/services that better meet their needs (Experian)
- More than 3 out of 4 Millennials will switch financial accounts if they find a better alternative (Experian)
- Most frequently mentioned reasons Millennials switch financial institutions include: better interest rates (47%), better reward programs (43%), better identity protection (32%) and better customer service (35%), among others (Experian)
- 54% of bank customers want their financial institution to locate discounts on purchases for them (Accenture)
- 38% of bank customers rate good online banking services as the top reason they stay with their bank (Accenture)
- 79% of bank customers said they would make more mobile payments if their financial institution offered discounted pricing and/or coupons based on past purchasing behaviors (Accenture)
- 78% of bank customers said they would increase their mobile usage if they received rewards points (Accenture)
- 54% of bank customers said they would make mobile payments if their FI offered discount pricing or coupons, and 53% would increase usage in exchange for rewards points (Accenture)
- 63% of Millennials and 54% of Boomers cite personal experience, reviews or recommendations as being the most influential when choosing where to open a checking account (Medallia)
- 80% of Millennials also cite personal experience, reviews or recommendations as the top reason for switching banks (Medallia)
- 13% of Millennials & 20% of Baby Boomers cited convenience as most critical in their bank selection process (Medallia)
- Millennials respond positively to innovation with nearly 65% reporting that their day-to-day behavior is driven by a desire to find new and better way of doing things (Medallia)
- 81% of Millennials and 72% of Boomers have interacted with their bank online in the past 30 days (logged into an online account and/or used a mobile banking application). Millennials are 2.6 times more likely to have used a mobile app (Medallia)
- 55% of Millennials rank technology failures or the inability to carry out a transaction online in their top three most frustrating banking experiences (Medallia)
- Boomers are 2.4 times more likely than Millennials to cite an interaction with a bank employee as driving a positive experience, and 1.7 times more likely to list bank employees as a top source of frustration (Medallia)
- Chase had the highest level of consumer engagement for the Bank category (Brand Keys)
- 3% of the banking industry rewards customers for at least one form of engagement (Cap Gemini)
- 92% of Millennials report being satisfied with their online banking experience at their primary bank, yet they also change banks more often than customers in other age groups (Accenture)
- 18% of Millennials said they switched from their primary bank in the past 12 months, compared with 10 percent of customers aged 35-54 and only 3 percent of people 55 and older (Accenture)
- Local/community banks are the biggest “winners” in attracting millennials with a 5% migration (Accenture)
- Large regional or national banks are the biggest “losers” with a millennial loss of 16% (Accenture)
- Credit unions experienced a 3% growth in new millennial customers (Accenture)
- 67% of millennials said that the traditional and digital banking experience they receive at their current bank is only somewhat or not at all seamless (Accenture)
- 47% of millennials said they would like their bank to provide tools and services to help them create and monitor their budget (Accenture)
- 48% of millennials said they would like their banks to offer video chat on their website or mobile/tablet application, compared to only 30% over 55 (Accenture)
- 55% of people chose rewards as the most attractive feature of their preferred credit card (TSYS)
- Only 1 in 10 consumers say financial services rewards programs offer an excellent service (Collinson Latitude)
- 63% of consumers are influenced by rewards offered when choosing a new bank and credit card (Collinson Latitude)
- 56% of Millennials said they would leave their current bank for an account that didn’t automatically pay overdraft items for a fee (Saylent)
- 54% of unbanked/underbanked consumers would switch to a financial institution that offered a product with no overdraft fees (Saylent)
- 70% of mass market consumers would enroll in eStatements to get a cash reward or a better interest rate (Saylent)
- 62% of retail banking executives think they are delivering excellent customer service but only 35% of retail customers agree - a 27% gap (IBM)
- Only 30% of customers believe they are receiving a personalized customer experience, while 45% of bankers indicate they think they are delivering on that promise (IBM)
- 96% of bankers believe their customers trust them more than other non-bank competitors - yet only 70% of customers agree (IBM)
- 48% of banks think they are doing a good job encouraging strong customer loyalty while only 35% of customers agree (IBM)
- Bank executives believe social is key and 54% expect to foster social communities among customers and prospects in the future. But only 18% of customers expect to engage this way (IBM)
- 42% of consumers identify failure to protect their personal data as the biggest threat to a financial firm’s reputation; this is prioritized above the ethical responsibility businesses have to customers and the community (23%) (Makovsky)
- 44% of financial firm executives have already lost 20% or more of their business over the past 12 months due to reputation and customer satisfaction issues (Makovsky)
- 61% of consumers still do not fully trust the financial firms they conduct business with on a regular basis (Makovsky)
- The financial crisis has had a strong effect on consumers’ lifestyles, including creating barriers to saving (29%), spending cut-backs (26%), financial hardship (24%), and diminished retirement (22%) (Makovsky)
- 77% of financial firm executives are concerned about losing customers to companies like Apple, Google, Amazon, Lending Club, etc., who could offer alternative financial services (Makovsky)
- 73% of consumers would likely switch to an alternative financial provider should there be a breach of their personal and financial information. 68% would also consider switching given negative news (illegal activity, fines, etc.) about their current financial services firms (Makovsky)
- 81% of financial firm executives agree increased regulations will improve their reputations and trust with customers faster (Makovsky)
- 79% of Millennials are more likely to switch financial service providers because of cyber security; 75% would change due to reputation and lower fees (Makovsky)
- 69% of U.S. Millennials were more likely to report trust in financial institutions, a trust that was still missing compared to consumers ages 35 to 54 (59%) and 55 and over (54%) (Makovsky)
- 79% of Millennials were more likely to change to an alternative digital financial services provider because of unauthorized access and theft of personal data (Makovsky)
- 75% of Millennials were more likely to change to an alternative digital financial services provider because of negative news relating to their financial institution (Makovsky)
- 76% of Millennials were more likely to change to an alternative digital financial services provider because of lower costs or fees, and 68% because of advanced and mobile technology for more helpful financial services (Makovsky)
- Reasons U.S. Millennials’ lifestyle have been negatively impacted by the financial crisis: not able to save (33%), significant spending cut backs (29%) and financial hardships (27%) (Makovsky)
- 49% of Millennials would be much more likely to consider banking and financial services from digital alternative providers like Google, Apple or Amazon is available, compared to consumers age 35 to 54 (37%) and age 55 and over (16%) (Makovsky)
- Of the total figure for all coalition loyalty programs (2.07 billion), 500.5 million belong to the banking sector (Finaccord)
- 32% of consumers prefer credit-card cashback programs (Excentus)
- 24% of consumers prefer credit card rewards (Excentus)

2015 Travel Loyalty Statistics
- Hotels that had the highest level of consumer engagement were: Wyndham Microtel (economy), Best Western (midscale), Hyatt (upscale) & Fairmont (luxury) (Brand Keys)
- Travelocity had the highest level of consumer engagement in the Online Travel Site Category (Brand Keys)
- Air Canada had the highest level of consumer engagement for the Airline category (Brand Keys)
- 79% of business travelers earned more than 100,000 frequent flyer miles over the past 12 months (ExpertFlyer)
- 60% of business travelers said they earned the majority of points by flying (ExpertFlyer)
- 39% of business travelers earned more miles through credit card purchases in 2015 (ExpertFlyer)
- 55% of Millennials earn travel points from a credit card (Hipmunk)
- 57% of GenX earns travel points from a credit card (Hipmunk)
- 43% of Millennials rank free wifi as their favorite hotel perk (Hipmunk)
- 41% of travelers prefer to receive products and services from a travel brand's own range and 82% want to choose which categories of rewards they receive (Collinson Latitude)
- While 15% of travelers believe they do not hear from their travel reward programs at all, 77% said they would like more input in shaping their own reward program experience (Collinson Latitude)
- On average travelers fly or stay in hotels 2-3 times a year, like to book travel online and are more often than not swayed by reward programs on offer when choosing where to buy travel (Collinson Latitude)
- 87.9% of frequent travelers usually define a redemption goal immediately following activation (Loy Logic)
- A survey of 10,000+ airline loyalty members indicates that reward choices surprisingly matter much more than program status (Loy Logic)
- 8% of Millennials are enrolled in 1 hotel loyalty program, 6% are enrolled in 2 and 86% none (Software Advice)
- 66% of Corporate Travel Managers agree hotel loyalty programs play at least a “slightly important” role in their negotiations with hotels and 20% admit they play a “very important” or “extremely important” role (GBTA)
- One-third of Travel Managers say they actively inform travelers about hotel loyalty programs (GBTA)
- 78% of Travel Managers are allowed to use individual hotel loyalty accounts when traveling for business (GBTA)
- 77% of Travel Managers are “somewhat interested” or “very interested” in a corporate loyalty program that rewards companies through various discounts and perks (GBTA)
- 72% of Travel Managers are “somewhat interested” or “very interested” in allowing travelers to belong to individual loyalty programs to accrue points more quickly if they booked through a channel agreed upon by both the Travel Manager and the hotel (GBTA)
- Of the total figure for all coalition loyalty programs (2.07 billion), 662 million belong to the airline sector (Finaccord)
- Of the total figure for all coalition loyalty programs (2.07 billion), 343.7 million belong to the hospitality sector (Finaccord)
- Of the total figure for all coalition loyalty programs (2.07 billion), 5.4 million belong to the travel sector excluding airlines (Finaccord)
- 17% of consumers prefer airline miles (Excentus)
- 14% of consumers prefer hotel points (Excentus)

2015 Loyalty Program / Loyalty Marketing Statistics
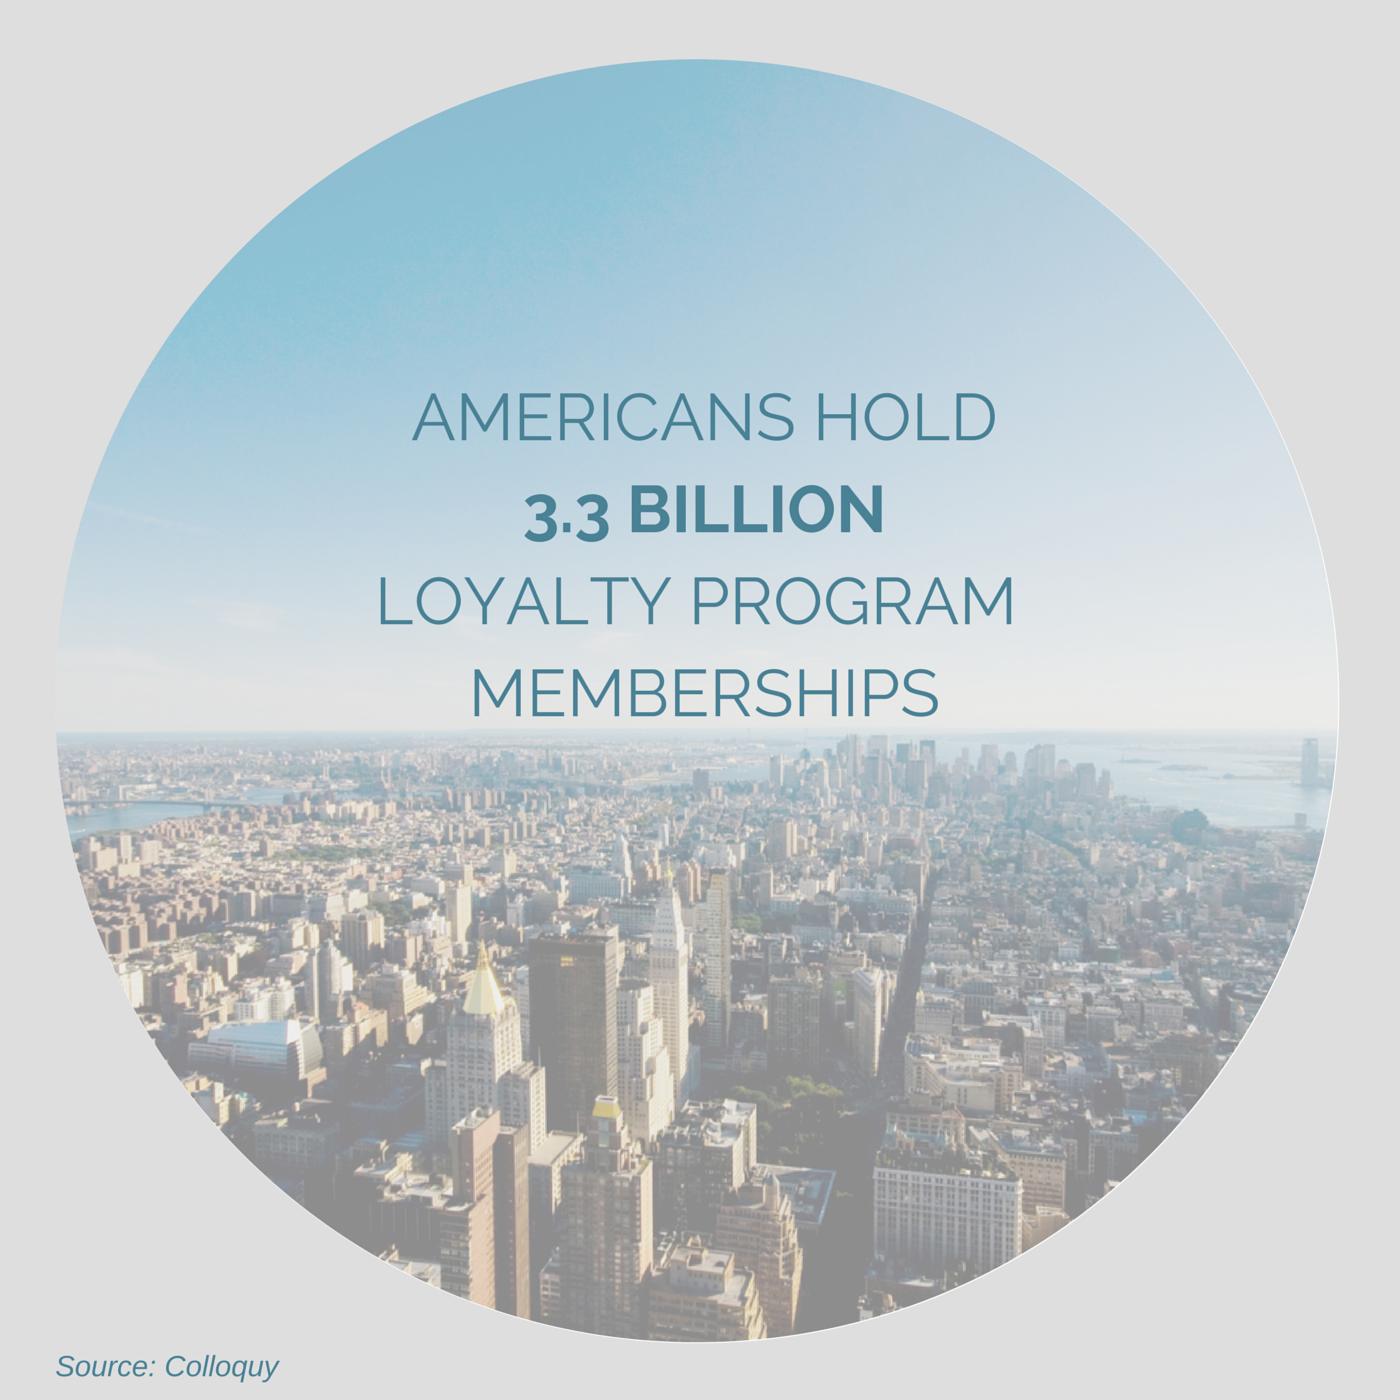
- There are 3.3 billion loyalty program memberships in the US, an average of 29 per household (Colloquy)
- 54% of consumers belong to loyalty programs that enable them to save on the cost of fuel, and rank these programs first for membership and activity over credit card cashback rewards, coupons, discounts, airline miles, hotel points and other rewards programs (Excentus)
- Top two benefits that motivate consumers to join a loyalty program are: earning points/miles on purchases (56%) and product or service offer/discount (55%) (Colloquy)
- Top two reasons consumers continue to participate in a loyalty program are: easy to understand (81%) and rewards and offers are relevant (75%) (Colloquy)
- Top two reasons consumers stop participating in a loyalty program are: did not provide rewards/offers that were of interest (56%) and too hard to earn points for rewards (54%) (Colloquy)
- 27% of consumers ranked the ability to earn points from multiple retailers as one of their top three appealing loyalty program features (Colloquy)
- Of the total membership in loyalty programs, 58% don't actively participate in those memberships (Colloquy)
- 34% of millennials said the word that best describes their participation in a customer reward program is “fun.” By comparison, 26% of the general population chose the word “fun,” meaning millennials scored 24% higher on the loyalty-needs-to-be-fun meter (Colloquy)
- Millennials rely on mobile apps (33%), smartphones/tablets (27%) or wearable devices (7%) to check their rewards status (Excentus)
- Millennials check their rewards status daily (13%) compared with Generation X (10%) or Baby Boomers (7%) (Excentus)
- Millennials are more enthusiastic (26%) than Gen X (19%) and Boomers (13%) about using loyalty rewards to save on the costs of driving (Excentus)
- Millennials would join a fuel savings reward program based on the recommendation of a family member or friend (19%), compared with Generation X (8%) or Baby Boomer (6%) consumers (Excentus)
- Millennials link their rewards-earning capability to a credit card (26%), compared to 10% and 8%, respectively, of Generation X and Baby Boomer consumers (Excentus)
- Millennials prefer a variety of rewards activities to save money, including retailer/brand coupons (26%), fuel savings rewards (25%) and instant cash-register discounts (23%) (Excentus)
- 66% of the general population said “economical” is the word that best describes their loyalty program participation, versus 56% of millennials (Colloquy)
- 63% of millennials said they had joined a program within the past year, versus 55% of the general population (Colloquy)
- 25% of millennials said they joined a program in the past year because it offered access to members-only events, versus 16% of the general population (Colloquy)
- 40% of millennials said they joined a program for access to members-only sales, products and services, versus 33% of the general population (Colloquy)
- 63% of millennials said it’s important that their loyalty program participation supports lifestyle preferences such as wellness programs, sustainability efforts or a charity, versus 53% of Gen X’ers (35-50) and 46% of baby boomers (51 and over) (Colloquy)
- 62% of consumers said they'd switch to grocery rewards if a grocer offering gas rewards gave them the option of a different type of reward; 24% said they'd stay with gas rewards; 8% said they'd opt for travel rewards; 6% chose electronics, housewares or apparel (LoyaltyOne)
- 49% of millennials stopped using a loyalty program after receiving irrelevant communications, compared to 37% of the general population (Colloquy)
- 18% of millennials stopped participating in a program because it lacked a smartphone app, compared to 13% of the general population (Colloquy)
- 27% of millennials continued their participation in a loyalty program because it featured a competitive game, or a social element such as badges, leaderboards or communities. By comparison, just 7% of baby boomers stayed with a program for those reasons (Colloquy)
- 42% of millennials continue to participate in a program because it has a mobile payment option, while just 15% of baby boomers said the same (Colloquy)
- 64% of enterprise mobile marketers said that their top priority for mobile apps is to enhance the customer experience and drive customer loyalty (FollowAnalytics)
- The loyalty management market is expected to grow USD 1.4 Billion in 2015 to USD 4.0 Billion by 2020 (Markets and Markets)
- Boomers (40%) don’t find loyalty programs as essential as Millennials (62%) and GenXers (64%) (Chase)
- 50% of marketers said they routinely apply data to engage consumers (TeraData)
- 37% of marketers used mobile campaigns for loyalty efforts, which were the most popular type of mobile campaign (Salesforce)
- The average number of programs in which consumers are enrolled continues to climb – from 10.9 programs per Member in 2014 to 13.3 programs per Member in 2015 (Bond)
- Despite the increase in average enrollments, the average number of programs in which members are active has decreased from 7.8 to 6.7 (Bond)
- 76% of Americans think that loyalty programs are part of their relationships with brands (Bond)
- 46% of shoppers who use loyalty programs consider them to be important in their decision to purchase (InReality)
- In the U.S. alone, companies spend a staggering $2 billion on loyalty programs every year (Cap Gemini)
- Key reasons for negative social media sentiment on loyalty programs: lack of reward relevance, flexibility & value (44%), lack of a seamless multi-channel experience (33%), customer service issues (17%) (Cap Gemini)
- Reward Mechanisms in Loyalty Programs: purchases (97%), activities (16%), participation in gamification campaigns (14%), mobile app downloads (6%), social media engagement (4%), in-store checkins (2%) (Cap Gemini)
- The average household in the U.S. has over 21 loyalty program memberships, but only actively uses 44% of these (Cap Gemini)
- 97% of loyalty programs rely on transactional rewards, i.e. a customer makes a purchase and takes their points in exchange for gifts, merchandise or cash (Cap Gemini)
- 77% of transaction-based programs actually fail in the first two years (Cap Gemini)
- Only 25% of loyalty programs reward customers for some form of engagement (Cap Gemini)
- Only 11% of loyalty programs offer personalized rewards based on a customer’s purchase history or location data (Cap Gemini)
- More than half of consumers in a 2013 survey admitted they had abandoned at least one loyalty program in the past year (Cap Gemini)
- 89% of social media sentiment on loyalty programs was negative among consumers (Cap Gemini)
- Among millennials, who are expected to spend more than $200 billion annually by 2017, negative sentiment towards loyalty programs stood at 85% (Cap Gemini)
- Overall, only 25% of companies reward any form of engagement (Cap Gemini)
- 57% of airlines reward customers for at least one form of engagement (Cap Gemini)
- 41% of hotel chains reward customers for at least one form of engagement (Cap Gemini)
- 35% of consumer products reward customers for at least one form of engagement (Cap Gemini)
- 15% of consumer electronics reward customers for at least one form of engagement (Cap Gemini)
- 7% of the telecom industry rewards customers for at least one form of engagement (Cap Gemini)
- 83% of companies support reward redemption on website, 62% in-store, 24% via mobile apps (Cap Gemini)
- Only 9% of companies support reward redemption across all channels (Cap Gemini)
- As many as 45% of loyalty programs follow a tier-based method (Cap Gemini)
- 62% of customers using the program’s mobile app are satisfied with the program, as compared to only 45% among members who have not downloaded a mobile loyalty app (Bond)
- 34% of customers say they would not be loyal to the brand if it weren’t for the brand’s loyalty program (Bond)
- 89% of social media sentiment toward loyalty programs is negative (Cap Gemini)
- 85% of Millennial social media sentiment toward loyalty programs is negative (Cap Gemini)
- 97% of loyalty program reward mechanisms are triggered by purchases (Cap Gemini)
- Just 25% of companies reward loyalty program members based on non-purchase interactions (Cap Gemini)
- 16% of loyalty programs reward customers for activities such as taking online surveys, rating and reviewing establishments or referring friends to the program (Cap Gemini)
- 66% of millennials respond to loyalty cards/discounts, 65% to couponing and 50% to store circulars (IRI)
- 86% of marketers ranked mobile loyalty campaigns as very effective or effective (Salesforce)
- 87% of consumers want a customer loyalty program (Talech)
- While 48% of members would like to engage with loyalty programs through their mobile device, only 12% have downloaded a program app, and 60% of smartphone owners are not even aware whether or not their program offers a mobile app (Bond)
- The participation rate in multiple loyalty programs is about 10% higher among slightly older millennials (25-34 years old) than younger (18-24 years old) (Software Advice)
- 46% of millennials say the number one reason for joining a hotel rewards program is because they are loyal to the hotel brand (Software Advice)
- 70% of millennials most often spend loyalty program points on a free or discounted stay or a room upgrade (Software Advice)
- 27% of millennials say they are “very likely” to post on social media about a hotel brand for loyalty points (Software Advice)
- Flexibility of how to redeem points (31.7%) as well as the ease of the process itself (23.7%), followed by the received value of the miles (21.3%) are most significant for members (Loy Logic)
- 81% of the members actively collect every possible extra mile/point (Loy Logic)
- More than 71% of those making $100,000 or more a year are enrolled in a loyalty program (Software Advice)
- 66% of travelers making $200,000 a year or more are likely to spend money when they think they have found a “good deal,” such as those offered to loyalty program members, versus 47% of those making $19,999 a year or less (Software Advice)
- 41% of millennials say they joined a hotel loyalty program because the rewards were easy to earn (Software Advice)
- 51% of millennials most frequently redeem loyalty points on a free or discounted stay, followed by room upgrades (19%) and airline tickets (12%) (Software Advice)
- 49% of millennials say they prefer to learn about their loyalty points via a simple notification email, 18% at check-in, 18% via online dashboard & 15% by app notification (Software Advice)
- 58% of millennials say they would find a mobile app for a hotel’s loyalty program “very” or “moderately valuable" (Software Advice)
- Brands that allocate 20% or more of their budgets toward customer loyalty have a better understanding of their customers (Loyalty360)
- 68% of companies report they are allocating less than 20% of their marketing budgets to loyalty, yet 58% of companies say that more than 20% of total sales or revenue is attributed to the program (Loyalty360)
- Nearly all the winners of the 2015 Loyalty360 Awards are investing more than 21% of marketing dollars to loyalty compared to one-third of the market at-large (Loyalty360)
- While a loyalty/rewards program is the component that is most widely included in loyalty strategies (78%), customer experience (69%) and customer engagement (66%) are included almost as frequently (Loyalty360)
- Other components commonly included in today’s loyalty strategies that fall outside of the “traditional” functionality are events (47%), employee engagement (37%) and experiential marketing (30%) (Loyalty360)
- Winners of the 2015 Loyalty360 Awards are including, on average, at least 11 different components in their loyalty strategies, compared to 7.5 components for the market-at large (Loyalty360)
- Engagement metrics are used by 60% of companies, followed closely by customer satisfaction (55%) and sales/revenue (53%) (Loyalty360)
- 68% of women said that getting rewards from a brand makes them stay longer, and not switch to other brands, versus 53% of men (Cherry London)
- Over half of consumers surveyed said they wanted to see a brand "invest heavily" in rewarding them for their custom (versus 42% who said they were happy with “a little" investment) (Cherry London)
- Receiving rewards influences behavioral metrics across both sexes: 65% said it impacts frequency of purchase, 64% said it influences the amount they spend and 69% said that it influences brand trial (Cherry London)
- 69% of consumers said rewards make them more likely to shop with a brand (Cherry London)
- 72% of women said rewards make them spend more vs. only 56% of men (Cherry London)
- Rewards entice 75% of women to trial a brand for the first time vs. 62% of men (Cherry London)
- Airlines have 355.9 million loyalty program members (Colloquy)
- Hotels have 288.7 million loyalty program members (Colloquy)
- Car Rental & Cruise industries have 44.9 million loyalty program members, 14% increase over last year (Colloquy)
- The gaming industry has 156.5 million loyalty program members, 4% growth over last year (Colloquy)
- Financial services has 577.9 loyalty program memberships, a 5% increase over last year (Colloquy)
- 42% of members are very satisfied with the program enrollment experience (Bond)
- 43% of members are very satisfied with the program experience (Bond)
- 45% of members are very satisfied with their entertainment program experience (Bond)
- 31% of members are very satisfied with their consumer packaged goods program experience (Bond)
- 34% of members would recommend their program to others (Bond)
- 28% of members feel very satisfied that they get a personalized experience (Bond)
- 10% of members follow a loyalty program on social (Bond)
- 37% of members strongly agree that programs are trustworthy (Bond)
- 33% of members say they visited the program’s website in the past year (Bond)
- 37% of members strongly agree their consumer packaged goods programs are trustworthy (Bond)
- 36% of members strongly agree their entertainment programs are trustworthy (Bond)
- 86% of members agree programs are definitely worth the effort (Bond)
- 83% of members agree that programs make them more likely to continue doing business with certain companies (Bond)
- 70% of members agree that they’d modify when and where they make purchases in order to maximize the benefits received (Bond)
- 64% of members agree that they’d modify what brands they purchase in order to maximize the benefits received (Bond)
- 49% of members agree they spend more with brand now vs. pre-membership (Bond)
- 44% of customers agree that it would be easy to replace the program with a competitor’s program (Bond)
- The fourth overall driver of brand satisfaction is loyalty/rewards programs at 7% (Bond)
- 82% of consumers said loyalty programs would be better if they offered more choice and would let them choose the categories of reward they wanted (79%) (Collinson Latitude)
- 72% of consumers would like better access to rewards online and the ability to redeem their rewards more easily (78%) (Collinson Latitude)
- 31% of consumers agreed they were receiving a 'great service' from their program (Collinson Latitude)
- Loyalty rewards is ranked above customer reviews (58%) and almost level with brand reputation (69%) in terms of their influence over consumers' decision-making process (Collinson Latitude)
- 62% of consumers said they’d consider joining a fee-based rewards program if their favorite retailer offered one (LoyaltyOne)
- 75% of 18-24 year-olds and 77% of 25-34 year-olds said they’d consider joining a fee-based rewards program (LoyaltyOne)
- 47% of consumers said rewards in fee-based programs are better than rewards in free programs (LoyaltyOne)
- 61% of 18-24 year-olds and 54% of 25-34 year-olds said fee-based rewards are better (LoyaltyOne)
- Of consumers who already participate in fee-based loyalty programs, 69% said they were enticed by free shipping, followed closely by special discounts at 67% (LoyaltyOne)
- Women (67%) are slightly stronger than men (64%) in their belief that rewards are worth paying for (LoyaltyOne)
- Category that’d be most appealing if compelling benefits were available through a fee-based program: Grocery & Mass Merchandise (35%), Credit Card Rewards(26%), Specialty Retail (13%), Travel (18%) and Restaurants (9%) (LoyaltyOne)
- 32% of 18-24 year-olds and 34% of 25-34 year-olds said they have never been offered membership in a fee-based program, versus 25% of the general population (LoyaltyOne)
- 79% of millennials ages 18 to 24 and 76% ages 25 to 34 said they would pay for rewards that correspond to their specific needs (LoyaltyOne)
- The total number of members of coalition loyalty programs worldwide is likely to have risen above 2 billion for the first time in 2015 (Finaccord)
- Around 2.07 billion consumers worldwide are likely to be members of at least one coalition loyalty program, which is equivalent to approximately 28.4% of the world's adult population (Finaccord)
- The largest coalition loyalty program in the world by number of members (with around 397 million) is India's Max Get More program (Finaccord)
- The average number of external currency-earning partners per coalition loyalty program is around 93 (Finaccord)
- The average number of external currency-redemption partners for coalition loyalty programs is 73 (Finaccord)
- 46% of consumers say they earn, buy, redeem or check their fuel-savings rewards daily or weekly (Excentus)
- 47% of consumers join rewards programs because they like saving money any way they can and 23% like earning rewards on everyday purchases (Excentus)
- 37% of consumers ranked fuel savings as their preferred rewards program (Excentus)
- 67% of consumers say they pay attention to gas prices and agree it is important to save on fuel when gas prices rise (64%) or fall (54%) (Excentus)
- 68% of consumers belong to fuel-saving rewards programs offered by grocery stores, 22% retail stores, 16% credit cards and 7% restaurants/dining venues. 46% of consumers say they join because rewards are offered as part of an existing loyalty program, 40% to save money, 37% to earn rewards where they already shop, 19% to save on the cost of driving, and 15% because the incentive is linked to a credit card (Excentus)
- 19% of consumers would choose a different brand to earn 25-50 cents per gallon on fuel, 17%-20% would switch retailers to earn 25 cents to $1 per gallon on fuel, and 20% would purchase in-store rather than online to earn 25-50 cents per gallon on fuel (Excentus)


2015 Retail Loyalty Statistics
- There are 229.6 million department store loyalty program memberships, an 18% increase from last year (Colloquy)
- 64% of retailers say their loyalty/rewards program is the best way to connect with consumers (Forrester)
- 35% of members strongly agree their retail programs are trustworthy (Bond)
- The average satisfaction score among those in a retail reward program was 4/5, compared to only 3/5 in the finance sector (Collinson Latitude)
- 74% of U.S. retailers reveal that customer engagement is their #1 concern; 62% of those retailers said they are increasing their budgets to enhance loyalty initiatives in 2015 (Boston Retail Partners)
- Shoppers who notify retailers of their poor experience and had their problem completely resolved were 84% less likely than silent shoppers to be at risk of decreasing their spend (LoyaltyOne)
- Millennials are more willing than their Baby Boomer parents or middle-aged Generation X consumers to switch retailers (78%) or brands (55%) in order to earn fuel savings rewards. Their preferred brand loyalties differ from older consumers by rates of 10%-17% (Excentus)
- About 50% of US consumers reported experiencing a problem on their last shopping trip. Of those customers, 81% decided not to contact the retailer about the issue. Among these silent shoppers, 32% said they were unlikely to recommend the retailer to friends and family (LoyaltyOne)
- 100% of the retailers surveyed said they plan to use analytics to better understand shopping behaviors within the next two years (Boston Retail Partners)
- Loyalty programs are a top priority for 46% of retailers (Boston Retail Partners)
- 181% more retailers plan to use gamification within loyalty programs in five years (Boston Retail Partners)
- 56% of retailers plan to participate in mobile loyalty applications in five years (Boston Retail Partners)
- 59% of shoppers said holiday gift return policies make or break their opinion of a retailer (Colloquy)
- 883% more retailers plan to have the ability to identify customers when they walk in the store via their smartphones in five years (Boston Retail Partners)
- 46% of retailers say loyalty programs are the best sales drivers (Forrester)
- 61% of retailers use points or benefits through the company’s loyalty program as a means of adding value to the customer relationship (Colloquy)
- 83% of retailers say that giving loyalty programs members more reward options is important (Colloquy)
- 45% of members are very satisfied with their retail program experience (Bond)
- 11% of retailers plan to adopt customer loyalty programs (Talech)
- 27.5% of retailers report that customer loyalty increased due to deploying in-store customer WiFi (EarthLink Holdings)
- 34% of consumers said they’re open to purchasing products and services from non-traditional (i.e., digital or online-only) providers (Accenture)
- 64% of consumers report being loyal to an existing grocery, but 90% agree that they are open to visiting other grocery stores based on promotions and incentives (Precima)
- 47% of consumers say relevant offers increase their grocery store loyalty (Precima)
- There are 267.6 million drug store memberships, 88% increase over last year (Colloquy)
- There are 433.5 million specialty retail memberships, 20% increase over last year (Colloquy)
- There are 169.7 million grocery memberships, a 2% decrease over last year (Colloquy)
- There are 164.3 million mass merchant memberships, a 17% increase over last year (Colloquy)
- There are 24.5 million fuel/convenience memberships, a 3% decrease over last year (Colloquy)
- Amazon had the highest level of consumer engagement in the Online Retailer category (Brand Keys)
- J. Crew had the highest level of consumer engagement in the Apparel Retailer category (Brand Keys)
- Marshall's & TJ Maxx had the highest level of consumer engagement in the Dept. Store Retailer category (Brand Keys)
- Walmart had the highest level of consumer engagement in the Discount Retailer category (Brand Keys)
- Home Depot had the highest level of consumer engagement in the Home Improvement Retailer category (Brand Keys)
- Dick's had the highest level of consumer engagement in the Sporting Goods Retailer category (Brand Keys)
- 30% of mobile users use their device to compare prices when shopping in a bricks-and-mortar store (Forrester)
- 25% of mobile users search or redeem coupons on their smartphones (Forrester)
- 57% of mobile users admitted that loyalty programs and points are the top feature in a mobile wallet, with 56% giving that title to discounts and deals (Forrester)
- Based on overall program satisfaction, the best mid-frequency retail program was Amazon, followed by Barnes & Noble. The worst was Best Buy (Bond)
- Based on overall program satisfaction, the best high-frequency retail program was Kroger, followed by Food Lion. The worst was Target Pharmacy Rewards (Bond)
- Based on overall program satisfaction, the best consumer packaged goods program was L’Oreal Paris, followed by General Mills. The worst was Pepsi (Bond)
- Based on overall program satisfaction, the best entertainment program was Regal Cinemas, followed by AMC. The worst was Cinemark (Bond)
- Top 5 loyalty program climbers over the last year were SUBWAY Rewards (+31%), Barnes & Noble Member (+31%), The Children’s Place myPLACE Rewards (+30%), ShopRite Rewards Program (+26%) and Lowe’s MyLowes (+26%) (Bond)
- Top 5 loyalty program decliners in the past year were Qdoba Rewards (-11%), Kraft First Taste (-12%), Dove Insider (-13%), Outback Steakhouse My Outback Rewards (-19%) and My Best Buy (-27%) (Bond)
- Top 5 loyalty programs are Amazon Prime (47%), Costco Executive Gold Start Membership (45%), Kroger Fuel (45%), Jiffy Lube Rewards (44%) and Denny’s Rewards (41%) (Bond)
- Top 3 programs that make its customers more loyal to the brand are GameStop PowerUp Rewards (44%), Cabela’s CLUB REWARDS (43%) & L’Oreal Paris Gold Rewards (43%) (Bond)
- Bottom 3 programs that make its customers more loyal to the brand are Kellogg’s Family Rewards (16%), American Eagle Outfitters AERewards (14%) and Pepsi Experience Points (12%) (Bond)
- Over 50% of shoppers say they would pay a higher price for the customer experiences they value most, and 77% of shoppers would be more loyal to stores that provide their personal top three customer experiences (Synchrony Financial)
- 73% of customers will shop at an apparel store more often as a result of helpful, attentive associates; clothes they like and a variety of merchandise; and good value and prices (Synchrony Financial)
- 62% of shoppers will visit a department store more if there are helpful, courteous associates; value, affordability and good sales; and clothes they like in their size (Synchrony Financial)
- For mass merchants, 57% of customers want a one-stop shopping experience and good discounts, deals and prices; the merchandise they want; and to make one trip with products that are easy to find (Synchrony Financial)
- 89% of millennials indicate they would be more loyal to retailers offering the benefits they want most. Millennials (69%) and Gen Xers (55%) are also more likely to pay more for the experiences they value (Synchrony Financial)
- 25% of consumers prefer retailer/brand coupons (Excentus)
- 24% of consumers prefer cash-register instant discounts (Excentus)
- 22% of consumers prefer retailer-specific points/rewards (Excentus)
- 16% of consumers prefer grocery rewards (Excentus)
- Of the total figure for all coalition loyalty programs (2.07 billion), 169.9 million belong to the retailsector (Finaccord)

2015 Restaurant Loyalty Statistics
- One of the top brands that best meets millennial consumers’ expectations and, therefore, to which Millennials are most engaged and loyal to is Chipotle (Brand Keys)
- 16% of consumers prefer restaurant rewards (Excentus)
- Restaurants have 54.8 million loyalty program members, 107% increase over last year (Colloquy)
- 52% of members are very satisfied with their casual dining program experience (Bond)
- 41% of members are very satisfied with their quick serve restaurant program experience (Bond)
- 42% of members strongly agree their casual dining programs are trustworthy (Bond)
- 41% of members strongly agree their quick serve restaurant programs are trustworthy (Bond)
- 9% of consumers find Restaurants to be the most appealing category if compelling benefits were available through a fee-based program (Loyalty One)
- 7% of consumers belong to fuel-saving rewards programs offered by restaurants/dining venues (Excentus)
- Based on overall program satisfaction, the best quick serve restaurant program was Subway, followed by Chick-fil-A. The worst was Qdoba Mexican Grill (Bond)
- Based on overall program satisfaction, the best casual dining program was TGI Fridays, followed by Pizza Hut. The worst was Outback Steakhouse (Bond)
- One of the top loyalty program climbers over the last year was SUBWAY Rewards (+31%) (Bond)
- Some of the top loyalty program decliners in the past year were Qdoba Rewards (-11%) and Outback Steakhouse My Outback Rewards (-19%) (Bond)
- One of the top loyalty programs is Denny’s Rewards (41%) (Bond)
Topics:


Share your Comment.